Chengyu Cup · Urban Behavioral Space & Living Circle Optimization · Entry I1534城垣杯 · 城市行为空间与生活圈优化 · 报名编号 I1534

Community Environment Optimization Model
Based on Residents' Emotional ValueResidential Land Efficiency
基于居民情绪价值住宅用地效率
社区环境优化模型

Community Environment Optimization Model
Based on "Residents' Emotional Value – Residential Land Efficiency"
基于"居民情绪价值 – 住宅用地效率"的社区环境优化模型

Institution参赛单位 School of Architecture · School of Intelligence and Computing, Tianjin University天津大学建筑学院 · 智能与计算学部
Study Cities研究城市 Shanghai · Beijing上海市 · 北京市
Track投稿方向 Urban Behavioral Space & Living Circle Optimization城市行为空间与生活圈优化
9Team Members参赛成员
17Indicator Dimensions指标维度
86,445Sentiment Text Records情绪文本数据
2Comparison Cities对比城市
Scroll down向下滚动
01 · Research Background

Research Background & Significance研究背景与意义

China's urban development is shifting from incremental expansion to stock-based renewal. Renovation of aging neighborhoods and improvement of residents' happiness have become central issues in urban planning.当前我国城市发展由增量扩张转向存量挖潜,老旧小区改造、居民幸福感提升成为城市规划的核心议题。

Urban Space Enters the Stock Planning Era城市空间进入存量规划时代

The main driver of urban planning for China's major cities over the next 30 years will be urban renewal, redevelopment, reuse, and transformation of industrial stock land. Cities like Shanghai and Beijing are accelerating the revitalization of existing land.中国主要城市驱动城市规划下一个30年的主要动力,将会是旧城更新、再开发、重新利用和工业等存量用地改造,上海、北京等大城市正加快存量用地盘活步伐。

Aging Neighborhoods Urgently Need Renovation老旧小区亟待改造升级

Aging residential communities face safety hazards due to outdated design standards. The Shanghai government has proposed using communities, blocks, and neighborhoods as renewal units to coordinate regional planning, spatial optimization, and functional transformation.老旧小区由于设计年限存在诸多安全隐患,设计理念跟不上时代。上海政府提出以小区、街区、社区为更新单元,统筹做好区域规划、空间优化、功能转化。

Over-urbanization Affects Residents' Happiness过度城市化影响居民幸福感

Urbanization has led to uneven development, increased population density, and rising housing prices. Major cities like Beijing and Shanghai rank lower in happiness than Lhasa and Hefei, leaving residents' aspirations for a "better life" unmet.城市化发展导致内部发展不平衡、人口密度增加、房价增高等问题。北京、上海等大城市幸福感低于拉萨、合肥等城市,居民"美好生活"期待尚待满足。

National Policy Oriented Toward People-Centered Humanism国家政策导向人本主义

President Xi Jinping's report to the 20th National Congress emphasized "continuously realizing the people's aspirations for a better life," requiring urban planning to treat residents' happiness as a core evaluation standard and comprehensively improve living conditions and cultural life.习近平总书记在党的二十大报告中指出"不断实现人民对美好生活的向往",要求城市规划将居民幸福感作为核心评价标准,全面提升居住条件与精神文化生活。

02 · Research Objectives

Research Objectives & Problems to Solve研究目标与拟解决问题

Propose a multi-source data-supported evaluation system for residential land efficiency and residents' happiness, deeply study their correlation, and promote progressive optimization of residential land use.提出基于多源数据支持的住宅用地效率与居民幸福感评价体系,深入研究二者相关性,推动住宅用地渐进式优化。

01

Scientifically Evaluate Inefficient Residential Land科学评价低效住宅用地

Address scattered and weakly targeted existing evaluation indicators; construct a three-dimensional indicator system covering social, economic, and ecological dimensions.解决已有评价体系指标散乱、针对性弱的问题,构建社会、经济、生态三维指标体系

02

Precisely Measure Residents' Happiness精准测度居民幸福感

Overcome the limitations of coarse traditional sentiment measurement with limited coverage by using massive social media text data.解决传统情绪测度方式粗放、可研究范围小的难题,采用海量社交媒体文本数据

03

Reveal Correlation Between Efficiency and Happiness揭示效率与幸福感相关性

Use advanced machine learning models to deeply analyze the mechanism by which residential land efficiency indicators affect residents' happiness.运用先进机器学习模型,深入分析住宅用地效率指标对居民幸福感的影响机制

04

Drive Progressive Renewal of Residential Land推动住宅用地渐进式更新

Use model algorithms to provide a basis for renovation priorities of residential land from a happiness perspective, achieving people-centered planning.利用模型算法,基于幸福感视角为住宅用地改造优先级提供依据,实现人本主义规划

03 · Study Area

Study Area研究区域

Shanghai was selected as the primary study city and Beijing as the comparative validation city, covering core residential neighborhood scenarios in megacities.选取上海市作为主要研究城市,北京市作为对比验证,覆盖超大城市核心住区场景。

Primary Study City主要研究城市
Shanghai上海市
Study scope: Huangpu, Xuhui, Changning, Jing'an, Putuo, Hongkou, Yangpu districts and Pudong New Area within the Outer Ring Road研究范围:黄浦区、徐汇区、长宁区、静安区、普陀区、虹口区、杨浦区及浦东新区外环内
Basic study unit: residential community基本研究单元:居住小区
6340.5
Total Area km²总面积 km²
24.87M
Resident Population常住人口
16
Districts下辖区
Comparative Validation City对比验证城市
Beijing北京市
Study scope: Six inner districts (Dongcheng, Xicheng, Chaoyang, Haidian, Fengtai, Shijingshan)研究范围:市内六区(东城区、西城区、朝阳区、海淀区、丰台区、石景山区)
Final count: 871 study units最终确定 871 个研究单元
16410
Total Area km²总面积 km²
21.84M
Resident Population常住人口
871
Study Units研究单元
Sentiment Text Data情绪文本数据
86,445 records
Beijing北京市
Weibo texts微博文本10,765
Douyin texts抖音文本75,680
04 · Data Sources

Multi-Source Data System多源数据体系

Integrates geospatial data, social media data, environmental monitoring data, and other data types to build a comprehensive analytical foundation.整合地理空间数据、社交媒体数据、环境监测数据等多类型数据,构建全面的分析基础。

🗺️

SHP Geographic Data地理数据

Source: Baidu API
Collected: June 2023
Use: Basemap & spatial analysis
来源:百度 API
采集:2023年6月
用途:底图与空间分析

📍

POI Point of Interest Data兴趣点数据

Source: Gaode API
Collected: 2023
Use: Facility accessibility calculation
来源:高德 API
采集:2023年
用途:设施可达性计算

🏔️

DEM Terrain Data地形数据

Source: Geospatial Data Cloud
Collected: August 2022
Use: Spatial analysis support
来源:地理空间数据云
采集:2022年8月
用途:空间分析辅助

📱

Mobile Signaling Data手机信令数据

Source: Mobile carriers
Precision: Geohash 7-digit (154m×154m)
Use: Neighborhood vitality measurement
来源:手机运营商
精度:Geohash 7位(154m×154m)
用途:邻里活力度测算

🌤️

Meteorological Monitoring Data气象监测数据

Source: China Meteorological Administration
Collected: Jan–Oct 2023
Use: PM2.5, SO₂ assessment
来源:中央气象台
采集:2023.01–10
用途:PM2.5、SO₂评估

💬

Weibo Text Data微博文本数据

Source: weibo.com
Collected: 2021–2023
Use: Resident sentiment analysis
来源:weibo.com
采集:2021–2023年
用途:居民情绪分析

🎵

Douyin Text Data抖音文本数据

Source: douyin.com
Collected: 2021–2023
Use: Resident sentiment analysis
来源:douyin.com
采集:2021–2023年
用途:居民情绪分析

🏠

Real Estate Data房地产数据

Source: Real estate platforms
Indicators: housing price, FAR, construction year
Use: Economic efficiency evaluation
来源:房地产平台
指标:房价、容积率、建成年代
用途:经济效益评价

05 · Methodology

Technical Workflow & Research Methods技术路线与研究方法

From indicator construction to machine learning interpretation, forming a complete "Data — Evaluation — Analysis — Interpretation" methodology chain.从指标构建到机器学习解释,形成完整的"数据—评价—分析—解释"方法链。

1

Construction of Residential Land Efficiency Indicator System住宅用地效率指标体系构建

Based on literature review, regional characteristics, and national standards (Community Living Circle Planning Technical Guidelines, Urban Residential Area Planning and Design Standards), 17 efficiency evaluation indicators were selected and refined, covering social, economic, and ecological benefit dimensions.基于文献研究、区域特点及《社区生活圈规划技术指南》《城市居住区规划设计标准》等国家规范,筛选并细化17个效率评价指标,涵盖社会、经济、生态三大效益维度。

Literature Review文献综述 Availability Screening可得性筛选 National Standards Validation国家标准校验 17 Indicators个指标
2

Entropy-Weight TOPSIS Method for Comprehensive Land Efficiency Evaluation熵权 TOPSIS 法评价用地综合效率

After spatial preprocessing of multi-type data, the entropy-weight method objectively determines each indicator's weight. The TOPSIS method then calculates each residential community's relative closeness to the ideal solution to produce a comprehensive efficiency score, grouped by natural breaks.对多类型数据进行空间预处理后,运用熵权法客观确定各指标权重,再通过 TOPSIS 优劣解距离法计算每个住区与理想解的相对贴近度,得出住区综合效率得分,并采用自然断点法分组。

ArcGIS Spatial Analysis空间分析 Entropy-Weight Method熵权法 TOPSIS Model模型 Natural Breaks Classification自然断点分组
3

Baidu NLP to Compute Residents' Happiness Scores百度 NLP 计算居民幸福感得分

Check-in texts from Weibo and Douyin were crawled, then classified using Baidu's PaddlePaddleNLP deep learning platform for sentiment polarity. Each text's positive and negative probability scores were obtained, and happiness scores were aggregated as "text score = positive score − negative score."爬取微博、抖音签到文本,使用百度 PaddlePaddleNLP 深度学习平台进行情感倾向分类,获得每条文本的正向概率与负向概率,最终以"文本得分 = 正向得分 − 负向得分"汇总计算住区幸福感均值。

Text Crawling文本爬取 Baidu NLP API PaddlePaddleNLP Spatial Interpolation空间插值
4

XGBoost Machine Learning Regression AnalysisXGBoost 机器学习回归分析

Using residential land efficiency indicators as features and happiness scores as the target, XGBoost gradient boosting tree models were trained, evaluating MAE, RMSE, and R² metrics. Models were trained separately for high/low efficiency communities to explore non-linear effects of efficiency on happiness.以住宅用地效率指标为特征、幸福感得分为目标,训练 XGBoost 梯度提升树模型,评估 MAE、RMSE 和 R² 指标,按高/低效率住区分段训练,深入探究效率对幸福感的非线性影响。

XGBoost Gradient Boosting梯度提升 High/Low Efficiency Segmentation高/低效率分段 MAE · RMSE · R²
5

TreeSHAP Interpretable Machine Learning AnalysisTreeSHAP 可解释性机器学习分析

TreeSHAP (a game-theory-based SHAP variant) was introduced to interpret the XGBoost model. Key indicators were identified by ranking mean absolute SHAP values; positive/negative effects of each indicator were observed via SHAP distribution plots; and individual sample prediction paths were explained using Waterfall Plots.引入 TreeSHAP(基于博弈论的 SHAP 变体)对 XGBoost 模型进行解释,通过 SHAP 绝对均值排序识别重要指标,通过 SHAP 分布图观察各指标的正负向影响,通过瀑布图(Waterfall Plot)解释单一样本的预测路径。

SHAP TreeSHAP Indicator Importance Ranking指标重要性排序 Waterfall Plot
06 · Indicator System

Residential Land Efficiency Evaluation Indicator System住宅用地效率评价指标体系

17 factor-level indicators are constructed across three benefit dimensions — social, economic, and ecological — covering built environment, service facilities, economic value, and ecological quality.从社会、经济、生态三大效益维度构建 17 个要素层指标,覆盖建成环境、服务设施、经济价值与生态质量。

Social Benefit社会效益 Social Benefit(11 items

Code代码 Indicator Name指标名称 Data Source数据来源 Calculation Method计算方法
A1Construction Year建成年代Real estate websites房地产网站Year built建成年份
A2Per Capita Floor Area人均建筑面积Real estate websites房地产网站Total floor area / total households × avg. persons总建筑面积 / 总户数 × 平均人数
A3Neighborhood Vitality邻里活力度Mobile signaling data手机信令数据Cumulative mobile users on weekdays, reflecting internal pedestrian activity intensity工作日内累计手机用户总数,反映内部人流活动强度
A4Transit Accessibility交通场站可达性OSM + POIMetro station 1000m coverage + bus stop 1000m coverage (binary sum)地铁站 1000m 覆盖 + 公交站 1000m 覆盖(二值加和)
A5Park & Plaza Accessibility公园广场可达性POIArcGIS service area analysis, 1000m coverageArcGIS 服务区分析,1000m 覆盖范围
A6Education Facility Accessibility教育设施可达性POIKindergarten 500m + primary school 1000m + middle school 1500m (triple sum)幼儿园 500m + 小学 1000m + 初中 1500m(三值加和)
A7Medical Facility Accessibility医疗设施可达性POIClinic 500m + specialist hospital 1000m + general hospital 1500m诊所 500m + 专科医院 1000m + 综合医院 1500m
A8Elder Care Facility Accessibility养老设施可达性POINursing home 1500m coverage养老院 1500m 覆盖范围
A9Shopping Facility Accessibility购物设施可达性POIMall / wet market / fresh supermarket 1000m coverage商场 / 菜市场 / 生鲜超市 1000m 覆盖
A10Cultural Facility Accessibility文化设施可达性POICultural facilities 1500m coverage文化设施 1500m 覆盖
A11Dining Facility Accessibility餐饮设施可达性POILife service facilities 1000m coverage生活服务设施 1000m 覆盖

Economic Benefit经济效益 Economic Benefit(4 items

Code代码Indicator Name指标名称Data Source数据来源Calculation Method计算方法
B1Floor Area Ratio (FAR)容积率Real estate websites房地产网站Total floor area / total land area总建筑面积 / 总用地面积
B2Housing Price房价Real estate platforms房地产平台Current price (CNY/m²)当前房价(元/m²)
B3Property Management Fee物业费Real estate platforms房地产平台Current fee (CNY/m²/month)当前物业费(元/m²/月)
B4Housing Vacancy Rate房屋闲置率Real estate platforms房地产平台Units for sale / total units在售房屋数量 / 房屋总数量

Ecological Benefit生态效益 Ecological Benefit(2 items

Code代码Indicator Name指标名称Data Source数据来源Calculation Method计算方法
C1Green Coverage Rate绿化覆盖率Green space SHP data绿地 SHP 数据Internal green area / total land area内部绿地面积 / 用地总面积
C2Air Pollution Index空气污染度Environmental monitoring stations环境监测站数据ArcGIS Thiessen polygon analysis, computing air pollution score from nearest monitoring stationArcGIS 泰森多边形分析,计算最近监测站的空气污染评分
07 · Results

Research Results研究结果

From spatial distribution of residential land efficiency and residents' happiness to machine learning correlation analysis, presenting comprehensive research findings.从住宅用地效率空间分布、居民幸福感分布到二者相关性机器学习分析,全面呈现研究发现。

Social Benefit Distribution社会效益分布

Construction years are mainly 1992–2008, with newer communities on the west side; per capita floor area is generally low, with eastern and northern areas relatively more spacious; most communities have low vitality, with higher vitality farther from the center.建成年代以 1992–2008 年为主,西侧小区整体较新;人均建筑面积整体偏低,东部和北部相对充裕;活力度偏低的小区占多数,距中心越远活力度相对越高。

Facility Accessibility Distribution设施可达性分布

Transit accessibility decreases from the city center outward; education and medical facilities broadly follow the "high center, low periphery" pattern with low-value clustering in the southeast; elder care accessibility is generally good, with high values concentrated in the west and south.交通场站可达性自市中心向外围递减;教育、医疗设施基本符合"中心高、四周低"规律,东南侧存在低值集聚;养老设施可达性整体较好,高值集中在西侧和南侧。

Economic Benefit Distribution经济效益分布

Floor area ratio is higher in the center and decreases outward; housing prices show a clear gradient decreasing from the center; western and southern areas have higher vacancy rates; the city center and transport-convenient areas have lower vacancy rates.中心区容积率大,向四周递减;房价呈明显梯度,自中心向外递减;西部和南部房屋闲置率高;市中心和交通便利地段闲置率较低。

Ecological Benefit Distribution生态效益分布

Green coverage is better on the east than west, with high values mainly in the southeast; the center and west have lower green rates. Air pollution is lower in the east than west, with higher pollution in the central commercial and busy traffic areas.绿化率东侧优于西侧,高值主要分布在东南方,中心区及西侧绿化率较低;空气污染东侧低于西侧,中心商业区和交通繁忙区域污染度较高。

TOPSIS Comprehensive Efficiency Evaluation ConclusionTOPSIS 综合效率评价结论

Based on the entropy-weight TOPSIS method coupling 17 indicators and grouped by natural breaks, community efficiency is relatively evenly distributed. High-efficiency communities are more concentrated on the west side than the east, while low-efficiency communities cluster in the north-central and northwest areas.基于熵权 TOPSIS 法耦合17个指标,以自然断点法分组,住区效率分布较为均匀,高效率住区分布在西侧多于东侧,低效率住区在中部偏北、偏西部较为集中。

Overall Distribution Pattern整体分布特征

Happiness score ranges are relatively concentrated with little overall variation.
Core urban areas generally show lower happiness; the farther from the core area, the higher the happiness level, with high values scattered around the periphery.
幸福感评价得分区间较为集中,整体差异不大。
核心城区幸福感普遍较低,离核心区越远,住区幸福感逐步升高,高值零散分布在核心区外围。

Spatial Pattern空间规律

Happiness shows a clear gradient pattern relative to distance from the core area. The high-density, high-stress inner-city environment negatively affects residents' emotions, while suburban environments are relatively more livable.幸福感与空间距离核心区的远近呈现明显的梯度规律,内城高密度、高压力环境对居民情绪有负面影响,郊区环境相对宜居。

Correlation Test (Spearman Correlation)相关性检验(斯皮尔曼相关)

Shanghai data p = 0.8 > 0.05; the correlation between efficiency scores and happiness is not significant, with an extremely low correlation coefficient. The data relationship is suspected to be complex, requiring machine learning models for further investigation.上海数据 p 值 = 0.8 > 0.05,效率得分与幸福感相关性不显著,相关系数极低。推测数据关系较为复杂,需引入机器学习模型进一步探究。

TreeSHAP model analysis of factors influencing residents' happiness in Shanghai's high-efficiency communities基于 TreeSHAP 模型对上海高效率住区居民幸福感影响因素的解析

Key Indicators (TOP 5):重要指标(TOP 5): Green coverage rate, housing price, FAR, neighborhood vitality, per capita floor area绿化覆盖率、房价、容积率、邻里活力度、人均建筑面积

Green Coverage Rate绿化覆盖率: Positively correlated with happiness; high greenery provides more open spaces, fostering harmonious neighborhood relationships.:与幸福感正相关,高绿化带来更多开放空间,推动邻里关系和谐密切

Housing Price房价: In high-efficiency communities, higher housing prices correlate with higher emotional value; residents are willing to pay for happiness.:高效住区中房价越高,居民情绪价值升高;体现居民愿以金钱置换幸福感

Floor Area Ratio容积率: Positively correlated with happiness; higher FAR corresponds to higher happiness.:与幸福感正相关,容积率越高,幸福感越高

Neighborhood Vitality邻里活力度: Positive correlation; increased vitality enhances residents' sense of belonging and security.:正相关,活力度增加提升居民归属感和安全感

Per Capita Floor Area人均建筑面积: Negative correlation; larger per capita floor area paradoxically corresponds to lower happiness.:负相关,人均建筑面积越大,幸福感反而越低

Construction Year建成年代: Negative correlation; older construction leads to aging facilities and lower happiness.:负相关,建成时间越久,设施老化,幸福感越低

Housing Vacancy Rate房屋闲置率: Negative correlation; higher vacancy rate represents resource waste and weakened neighborhood relationships.:负相关,闲置率越高代表社区资源浪费与邻里关系疏远

TreeSHAP model analysis of factors influencing residents' happiness in Shanghai's low-efficiency communities基于 TreeSHAP 模型对上海低效率住区居民幸福感影响因素的解析

Key Indicators (TOP 5):重要指标(TOP 5): Construction year, per capita floor area, housing price, property management fee, vacancy rate建成年代、人均建筑面积、房价、物业费、房屋闲置率

Construction Year建成年代: Negative correlation; older construction brings aging facilities, lowering residents' happiness.:负相关,建成时间旧带来设施老化等问题,降低居民幸福感

Housing Vacancy Rate房屋闲置率: Negative correlation; higher vacancy rate implies weaker neighborhood connections; loneliness affects happiness.:负相关,闲置率提高意味着邻里联系越不紧密,孤独感影响幸福感

Property Management Fee物业费: Positive correlation; reasonable management fees bring reliable service and management.:正相关,合理物业费带来有保障的服务与管理

Housing Price房价: Positive correlation; a reasonable housing price level is an important guarantee for residents' happiness.:正相关,合理房价水平是居民幸福感的重要保障

Per Capita Floor Area人均建筑面积: Positive correlation; in low-efficiency communities, adequate living space helps improve happiness.:正相关,在低效住区中,适当的居住空间有助于提升幸福感

Planning Recommendations规划建议

Residential development does not need to blindly pursue price superiority. Reasonable housing prices and property management fees that provide reliable service and management are the truly important guarantee for residents' happiness.住区建设不需要一味追求价格上的优胜,合理的房价、物业费带来有保障的服务与管理才是居民幸福感的重要保障。

Community Efficiency Distribution住区效率分布

High-efficiency communities cluster in ring-shaped distributions around the middle and outer ring roads. Characteristics: lower housing prices, but well-equipped medical and transit facilities and abundant open spaces like parks and plazas.高效住区集中分布在中环外环周边,呈圈状集中分布。特点:房价较低,但周边医疗、交通设施完善,公园广场等开放空间丰富。

Residents' Happiness Distribution居民幸福感分布

Communities between the 2nd and 3rd ring roads have the highest happiness, especially in the northwest. A notable low-happiness cluster exists between the 4th and 5th ring roads in the southwest (likely due to dense urban village areas).二环三环之间小区幸福感最高,西北侧表现尤为显著。西南侧四环与五环之间有明显幸福感集中偏低区域(推测因城中村分布密集)。

Correlation Validation相关性验证

Beijing data p = 0.03 < 0.05; the correlation between community efficiency and happiness is significant, with correlation coefficient r = 0.074, showing a statistically significant positive correlation.北京数据 p = 0.03 < 0.05,住区效率与幸福感相关性显著,相关系数 r = 0.074,显示具有统计学意义的正相关。

Key Indicators for Low-Efficiency Communities低效住区关键指标

Neighborhood vitality, housing price, construction year, medical accessibility, and housing vacancy rate are the 5 most influential indicators.
Special finding: Neighborhood vitality is negatively correlated with happiness — Beijing's low-efficiency residents prefer quiet and private environments.
邻里活力度、房价、建成年代、医疗设施可达性、房屋空置率为影响最大的5项指标。
特殊发现:邻里活力度与幸福感呈负相关——北京低效住区居民更倾向安静私密环境。

Key Finding for High-Efficiency Communities高效住区关键发现

In high-efficiency communities, neighborhood vitality has the highest predictive impact and is negatively correlated with happiness. Likely explanation: social atomization is pronounced in megacities; residents prefer quieter and more private settings, and excessive neighborhood vitality may interfere with daily life. Planning recommendation: emphasize activity/quiet zoning and careful delineation of public vs. private spaces.高效住区中,邻里活力度对预测影响程度最高,且与幸福感呈负相关。推测原因:特大城市社会原子化较为严重,居民更倾向于较为安静私密的场所,过高的邻里活力度可能干扰正常生活。规划建议:注重动静分区和公共性与私密性的划分。

Spatial Distribution空间分布 · Spatial Distribution

Spatial Distribution Maps空间分布图

GIS spatial distributions of all benefit indicators, comprehensive efficiency, and residents' happiness are presented in research logical order. Shanghai is the primary study city; Beijing is the comparative validation city.按研究逻辑顺序展示各项效益指标、综合效率与居民幸福感的 GIS 空间分布,上海为主研究城市,北京为对比验证城市。

Social Benefit社会效益 A1 Construction Year建成年代 · A2 Per Capita Floor Area人均建筑面积 · A3 Neighborhood Vitality邻里活力度

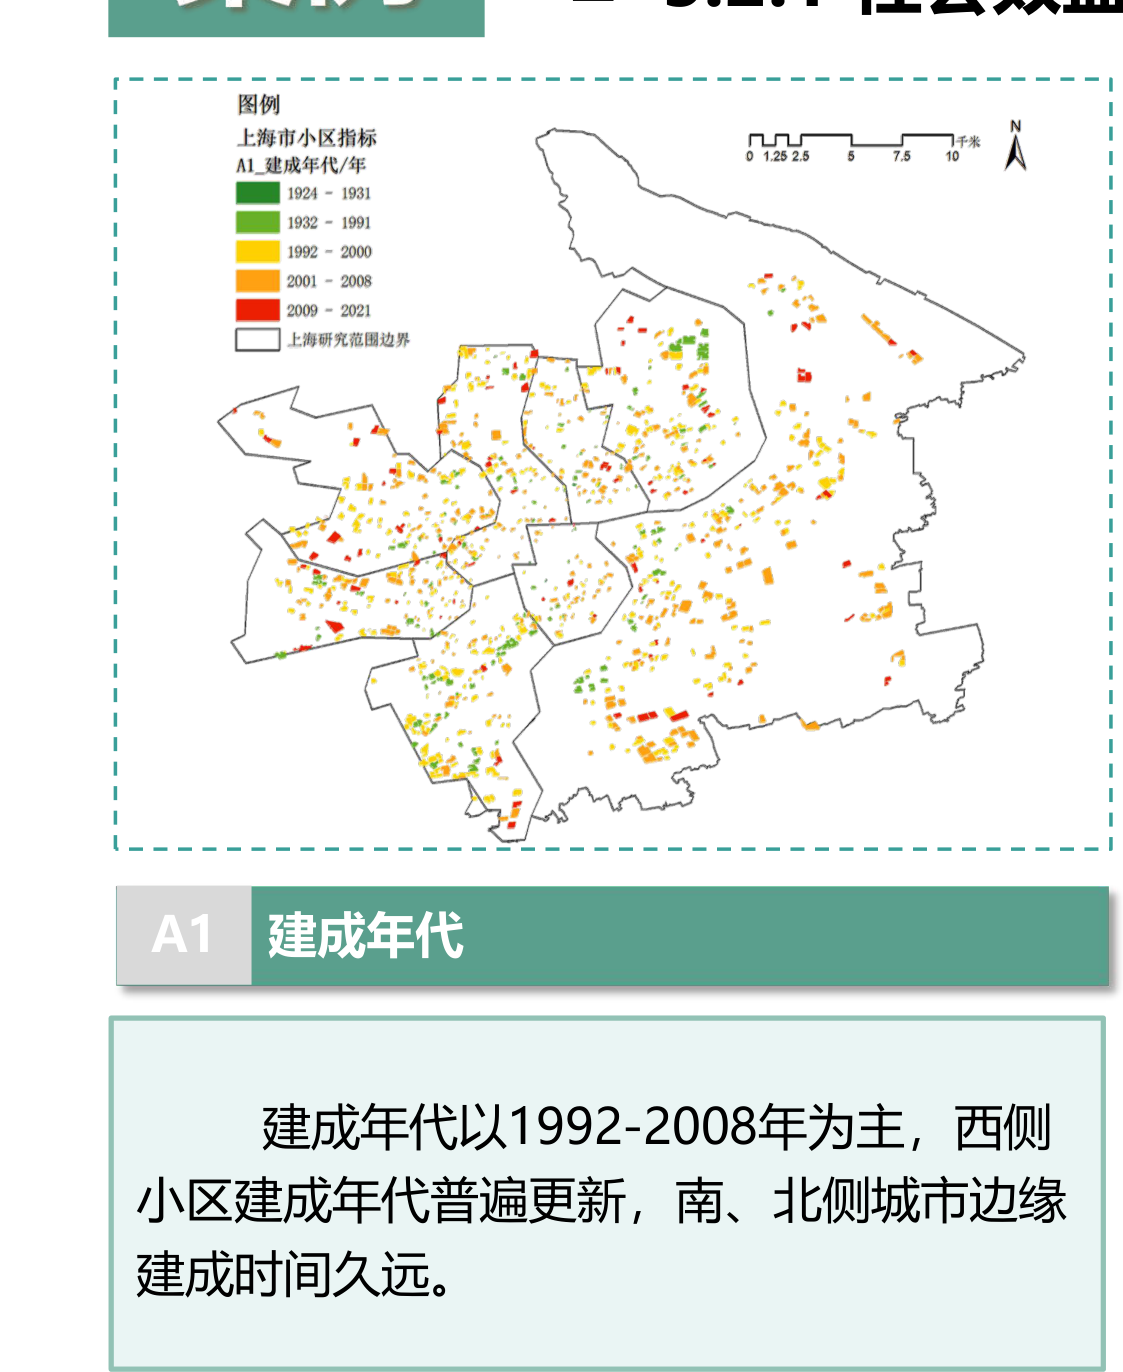
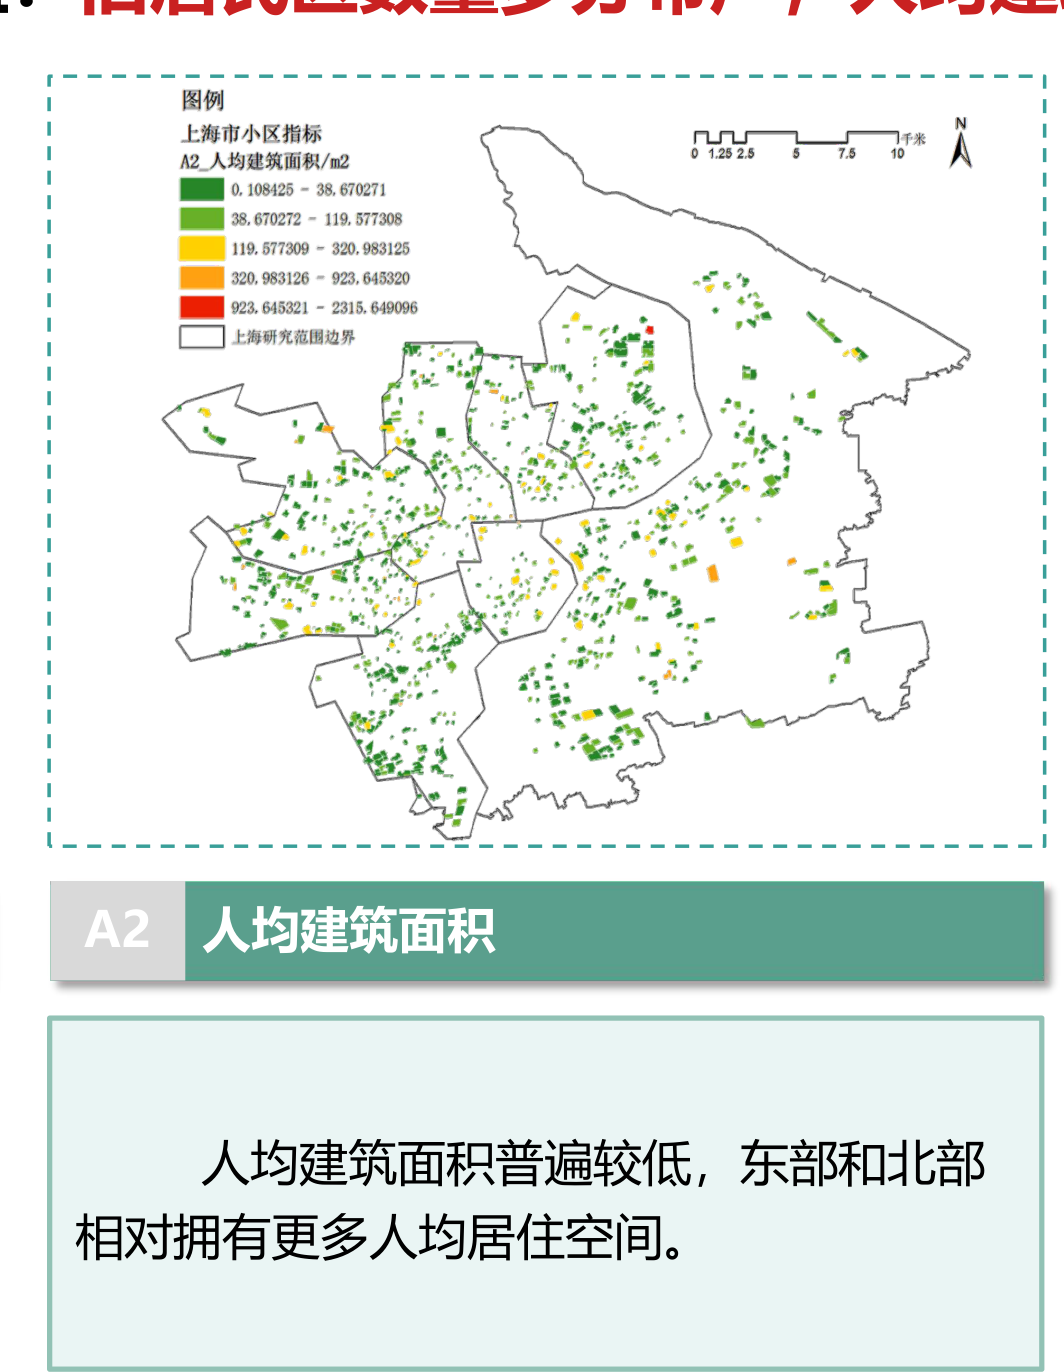
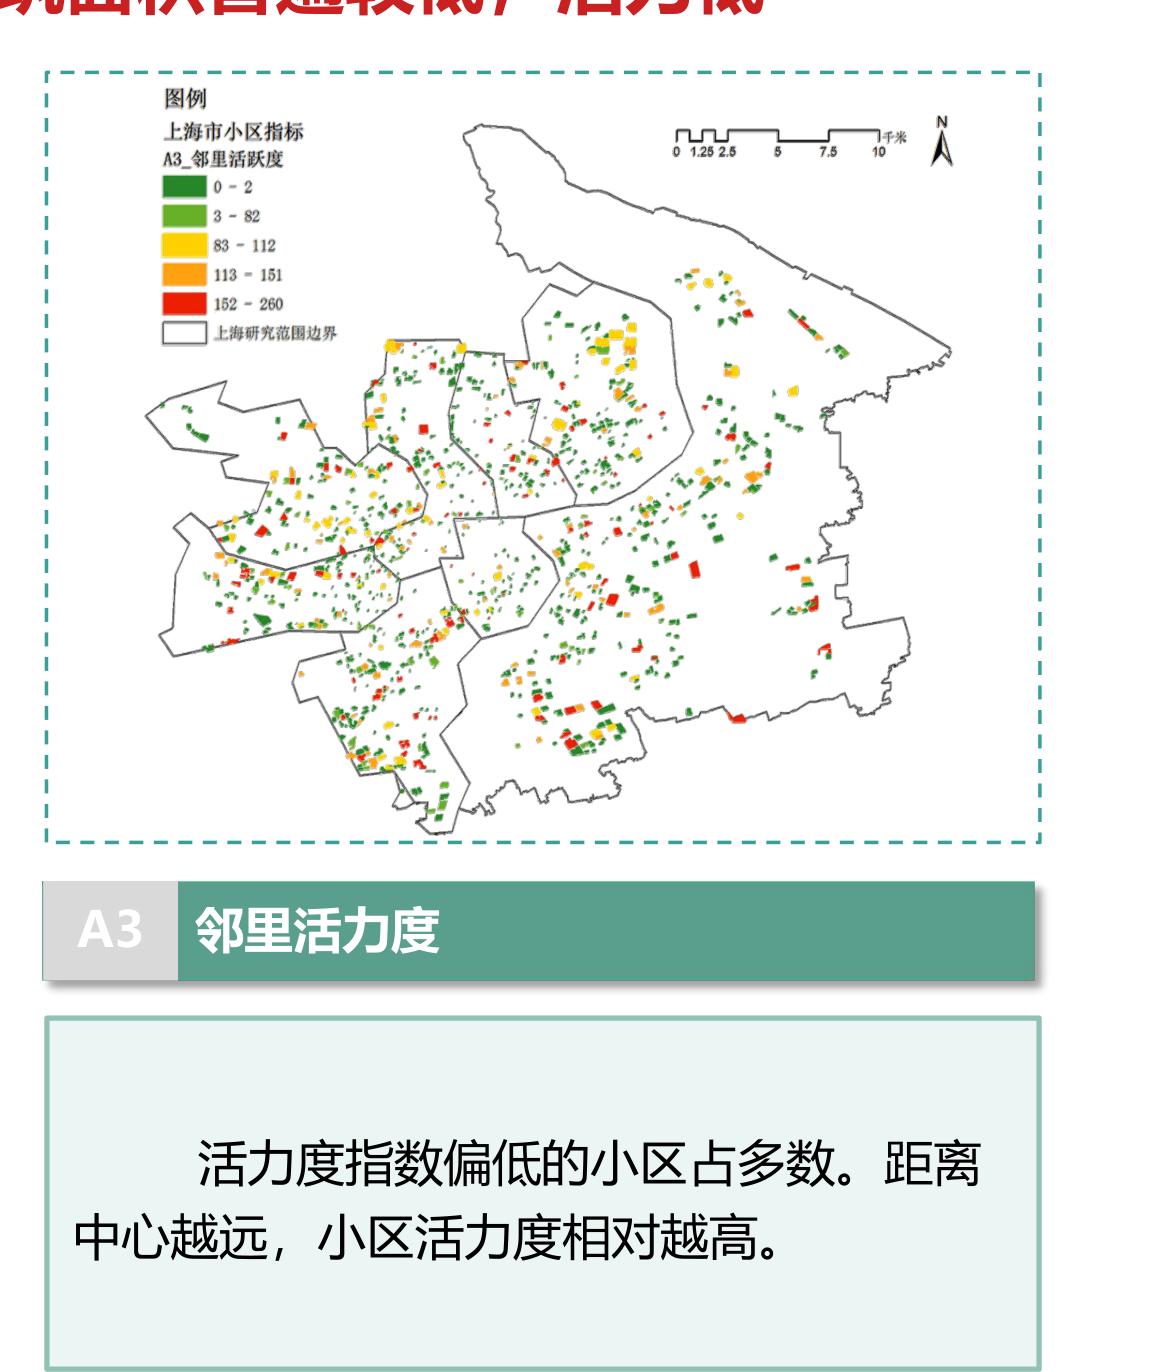
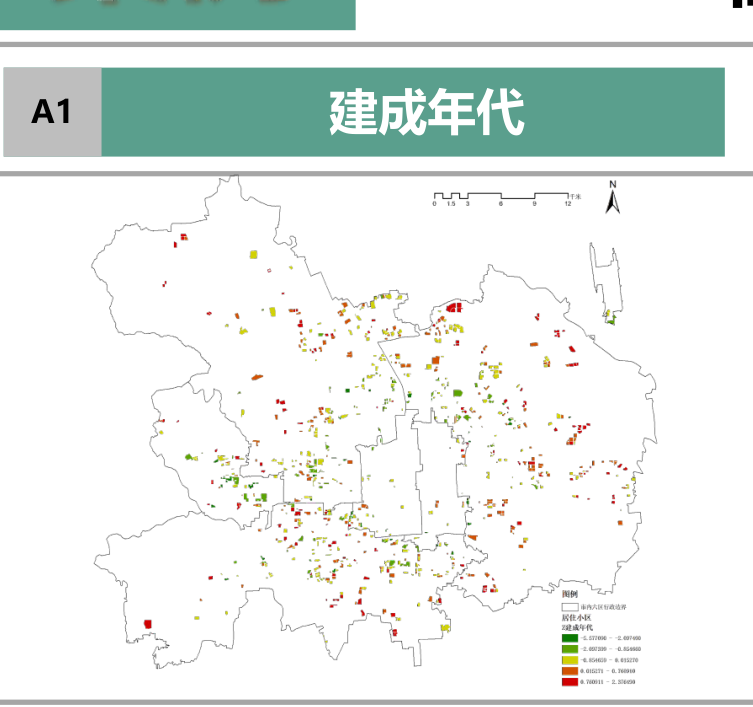
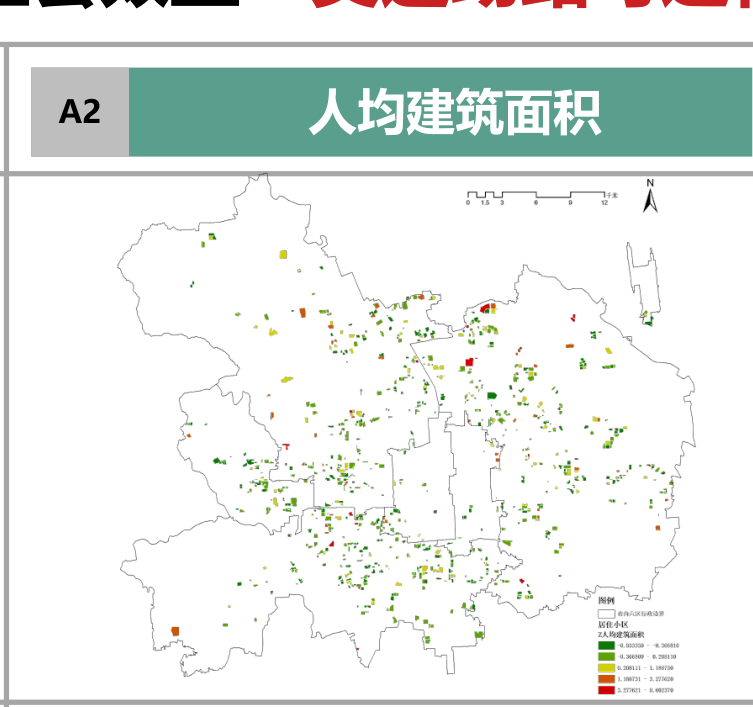
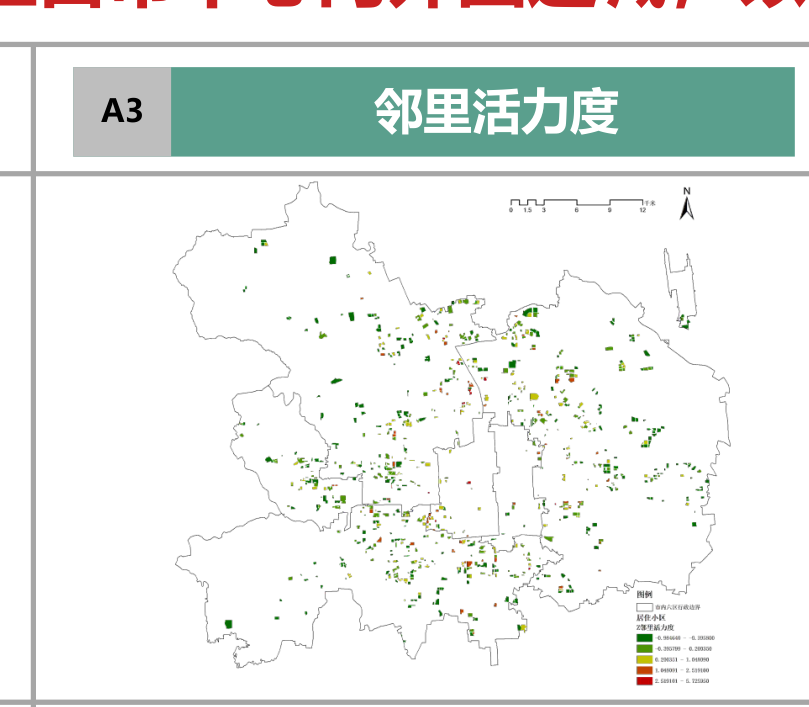
Construction years are mainly 1992–2008, with newer communities in the west and older ones at the north/south edges; per capita floor area is generally low; most communities have low vitality, with higher vitality farther from the center.建成年代以 1992–2008 年为主,西侧更新,南北侧边缘久远;人均建筑面积整体偏低;活力度偏低小区占多数,离中心越远活力度相对越高

A1建成年代
A2人均建筑面积
A3邻里活力度
Social Benefit社会效益 A4–A11 Facility Accessibility (Various Types)各类设施可达性

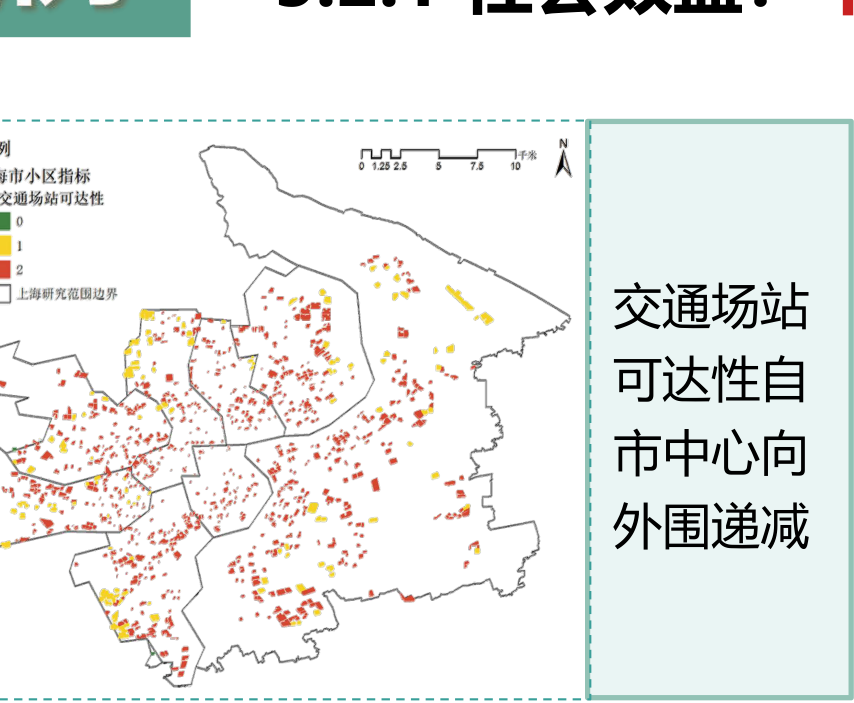
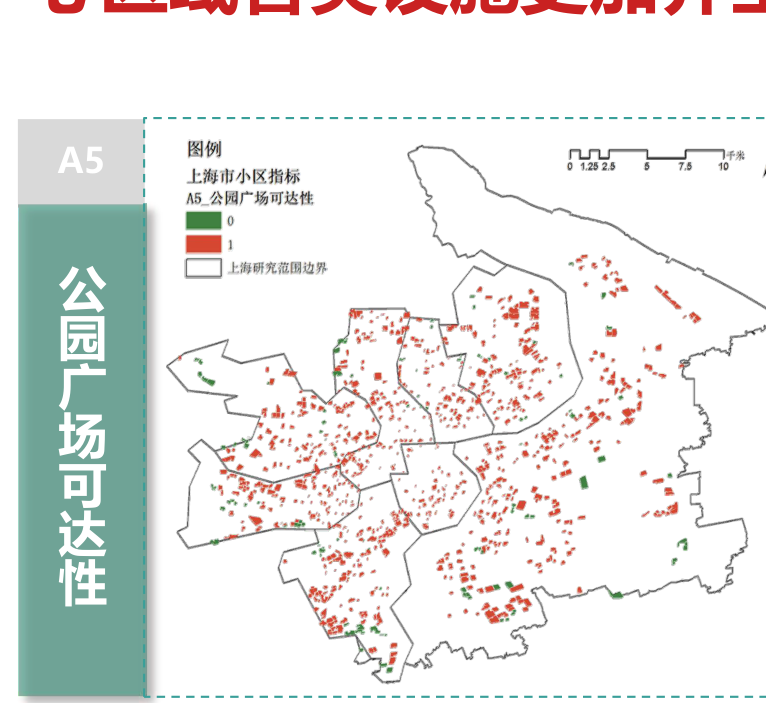
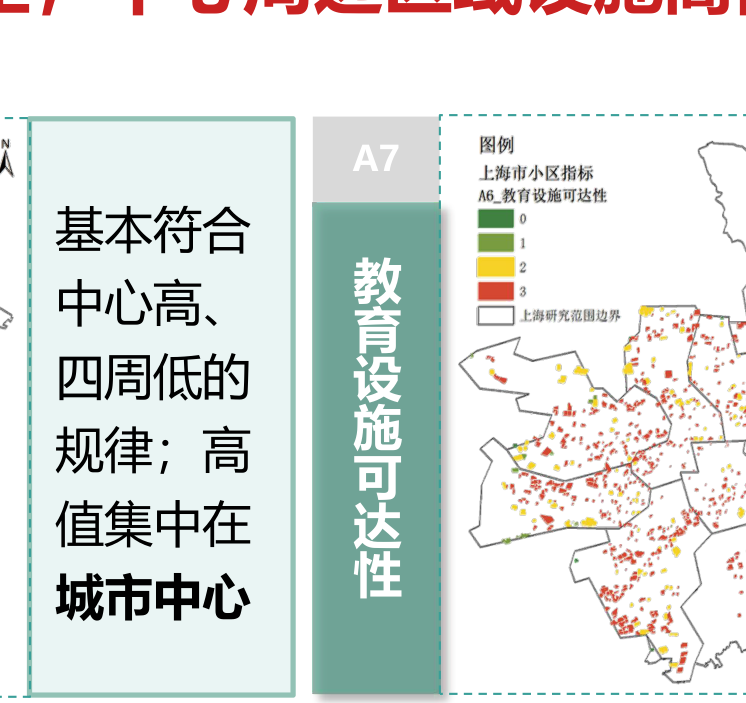
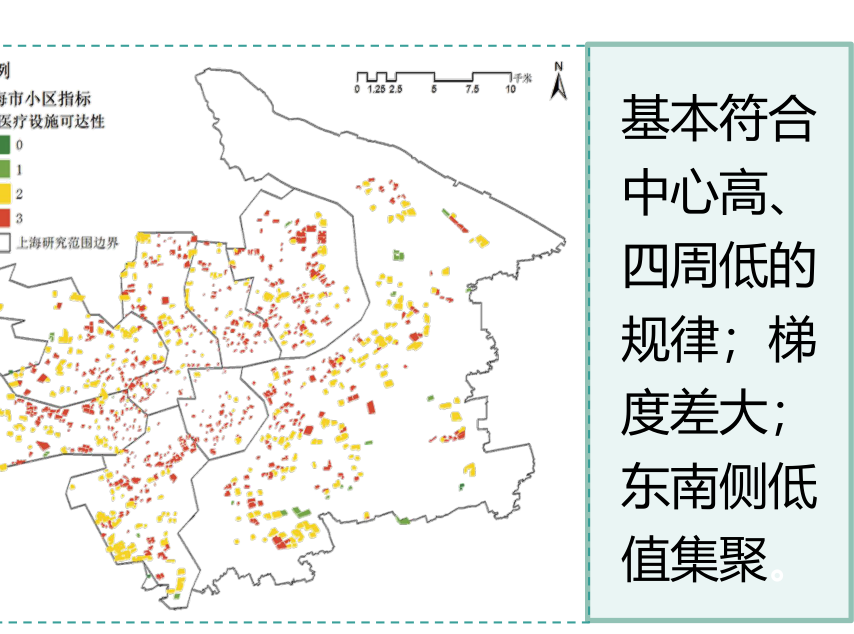
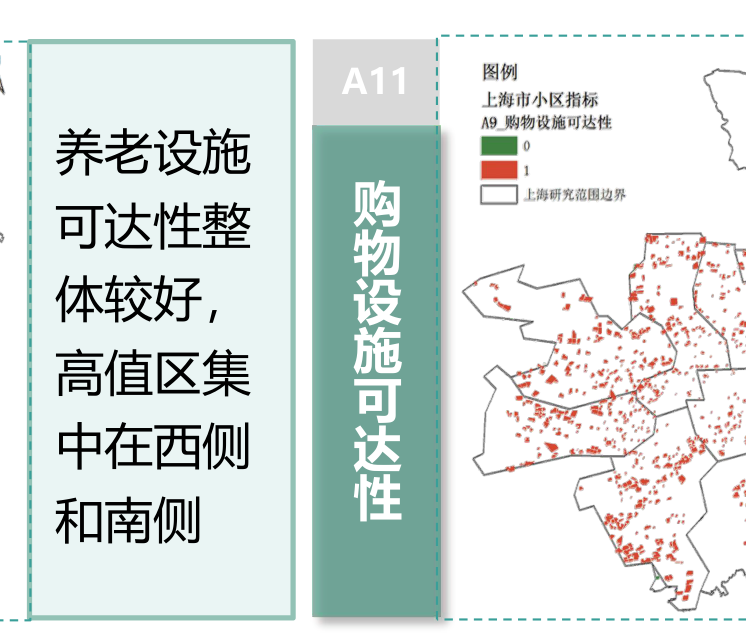
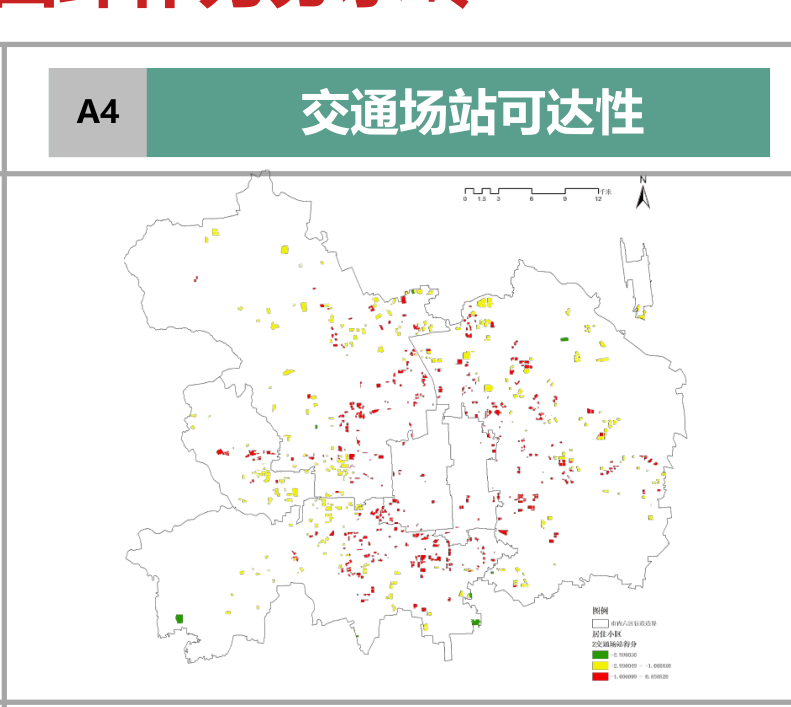
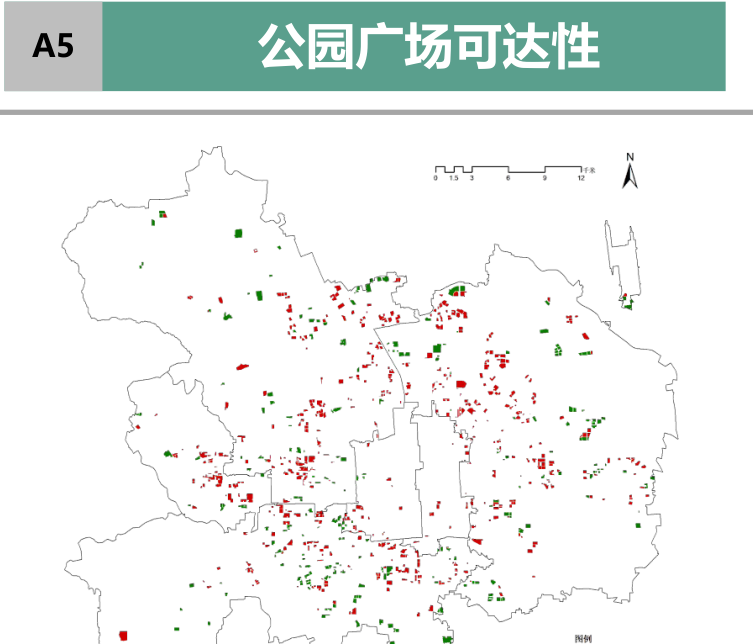
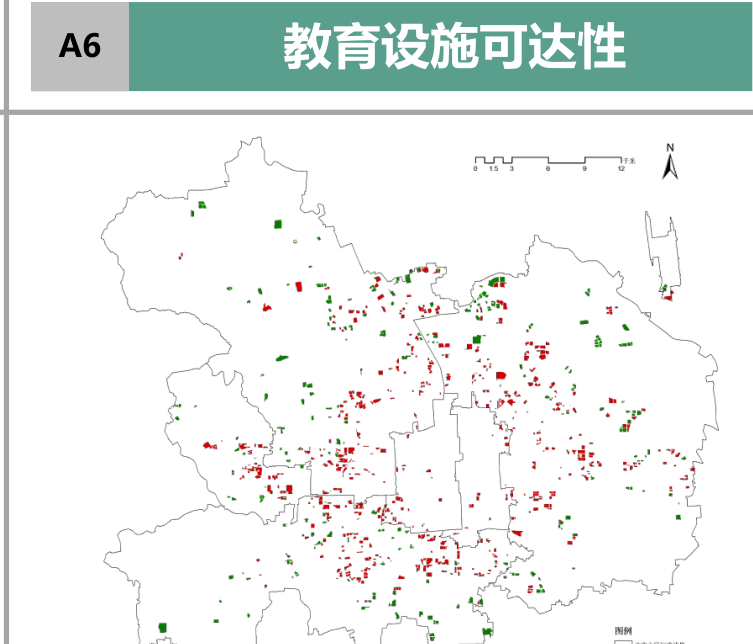
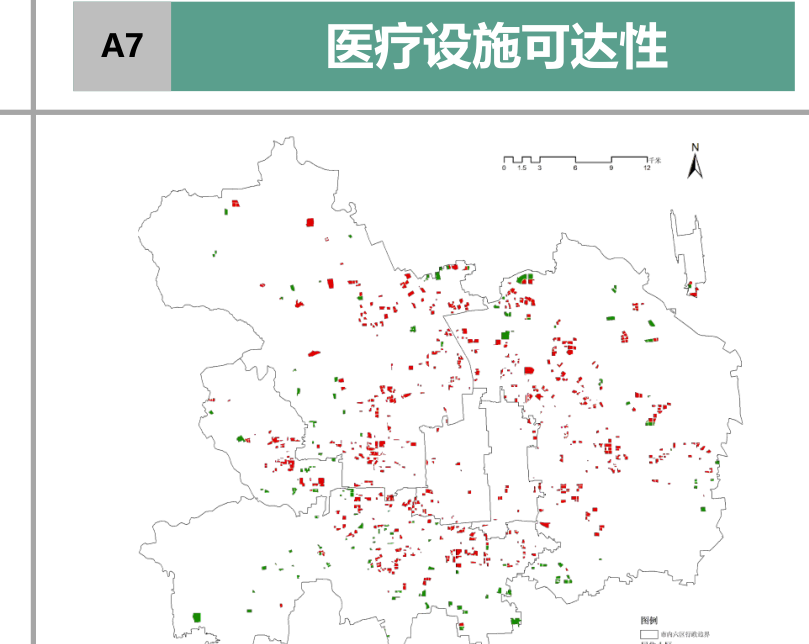
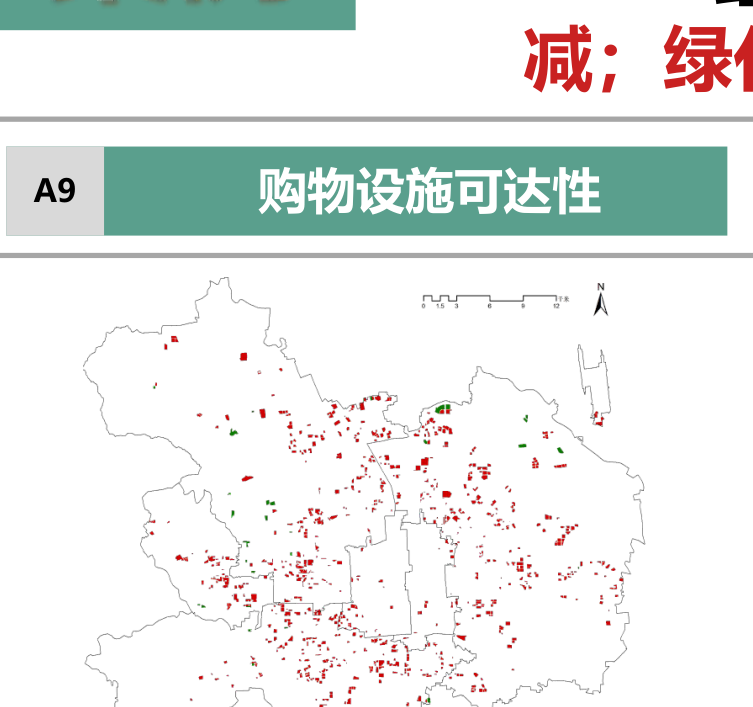
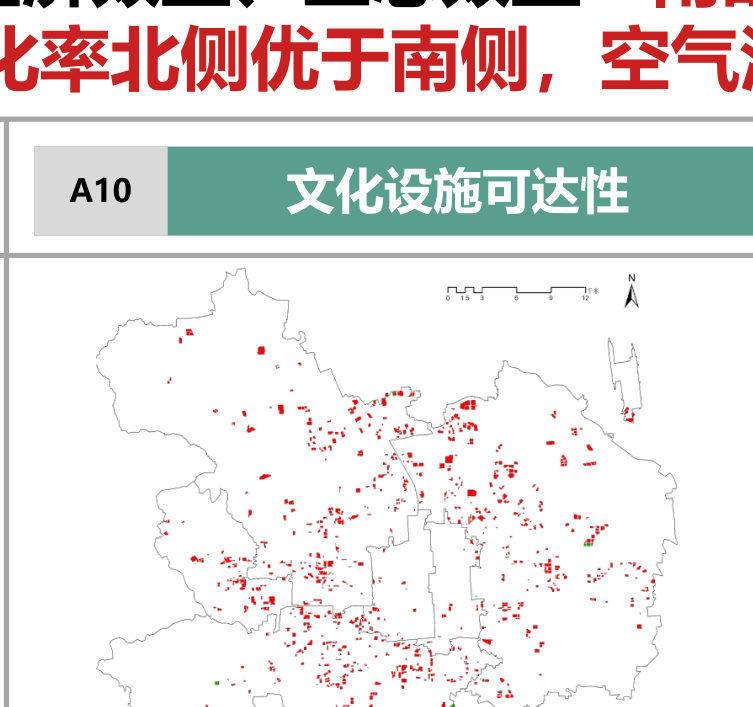
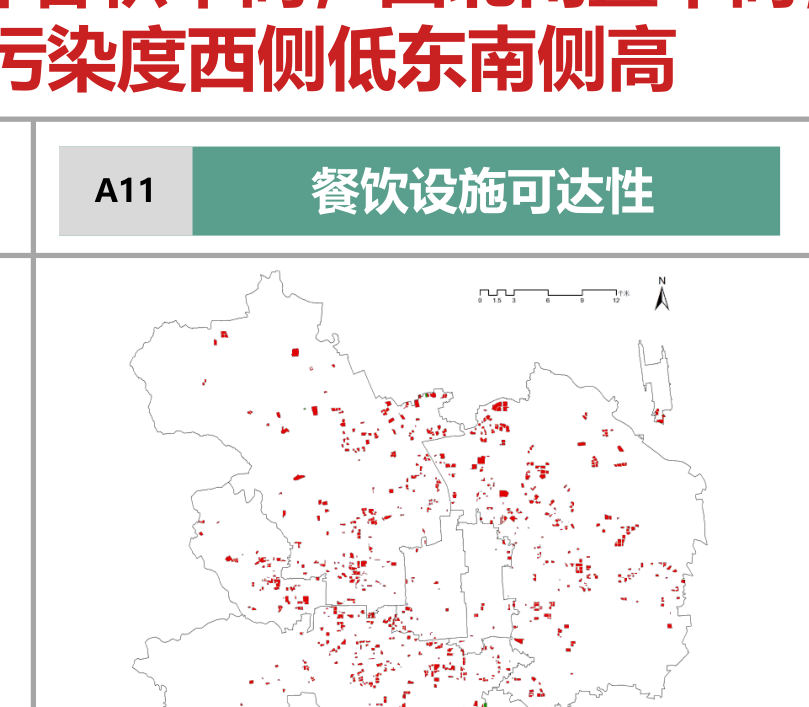
Central areas have more complete facilities; transit accessibility decreases from city center outward; education and medical follow the high-center, low-periphery pattern, with low-value clustering in the southeast.中心区域设施更加齐全;交通场站可达性自市中心向外递减;教育、医疗基本符合中心高四周低规律,东南侧低值集聚

A4交通场站
A5公园广场
A7教育设施
A8医疗设施
A9养老设施
A11购物设施
Economic Benefit经济效益 B1 FAR容积率 · B2 Housing Price房价 · B3 Management Fee物业费 · B4 Vacancy Rate房屋闲置率

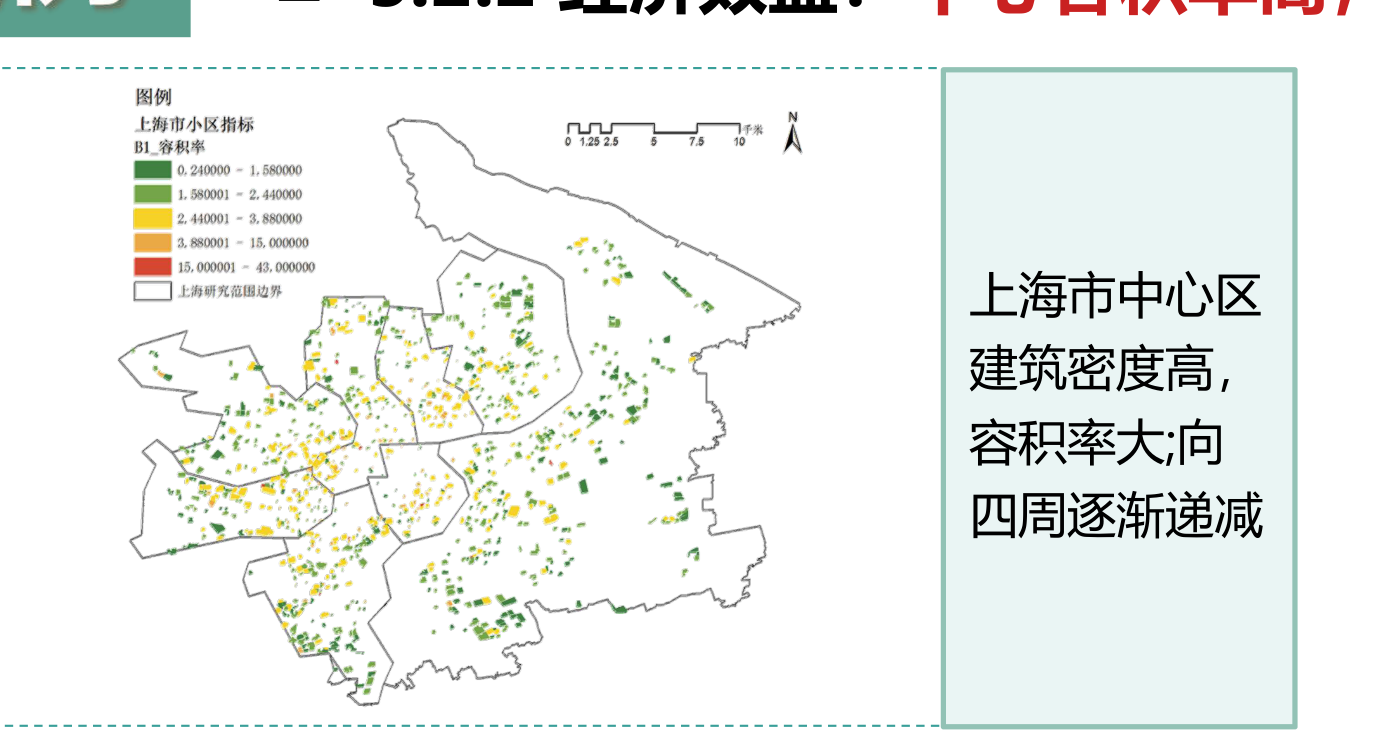
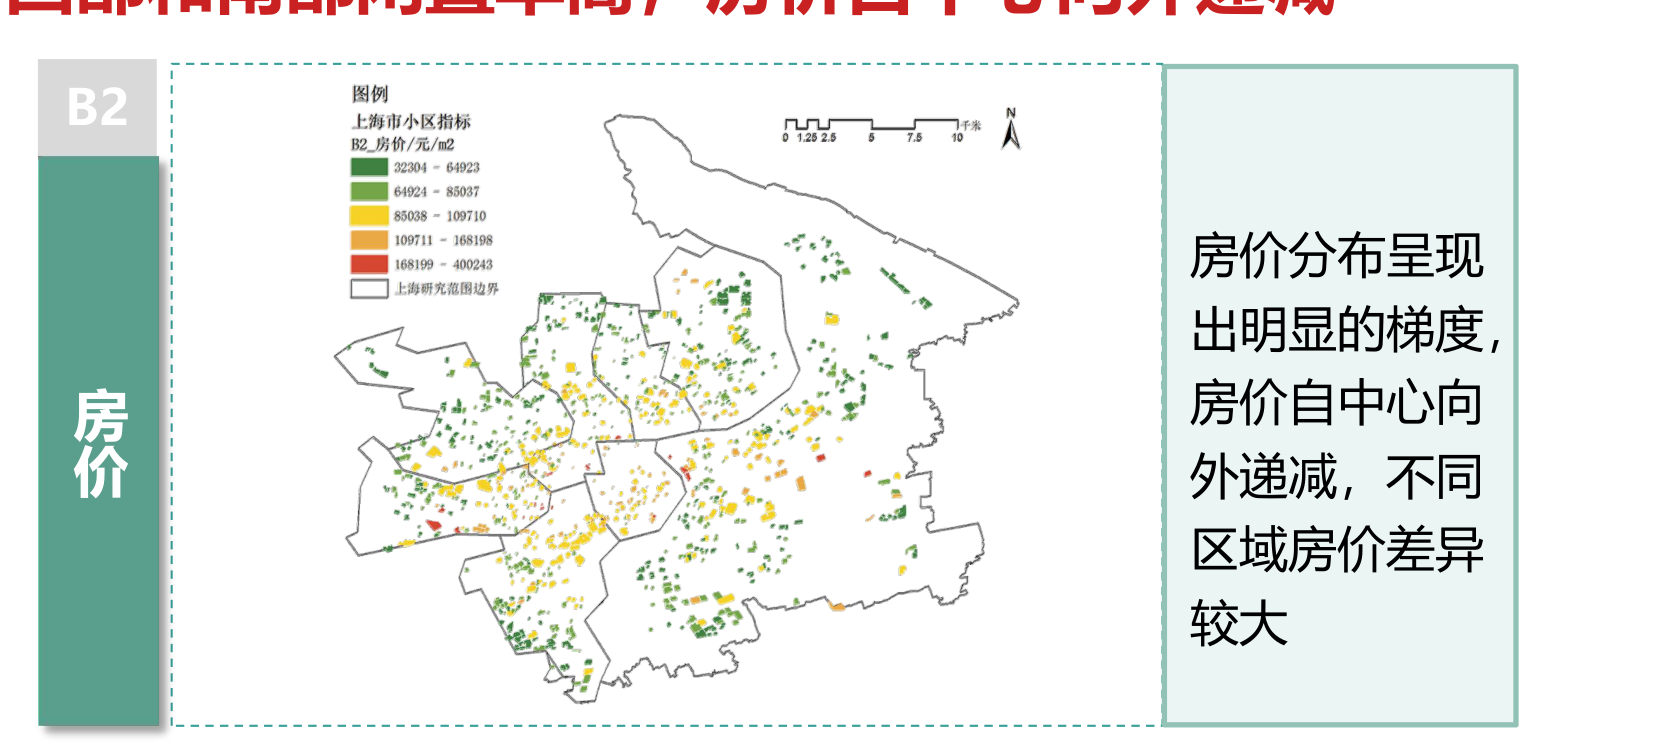
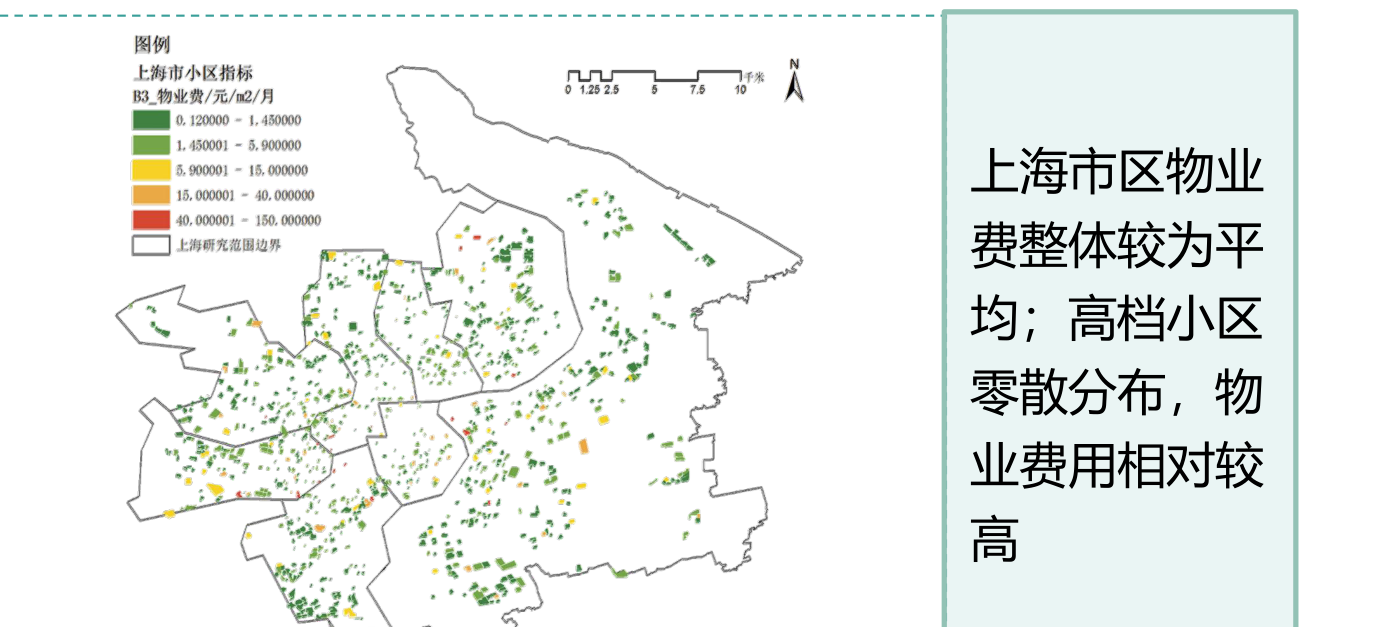
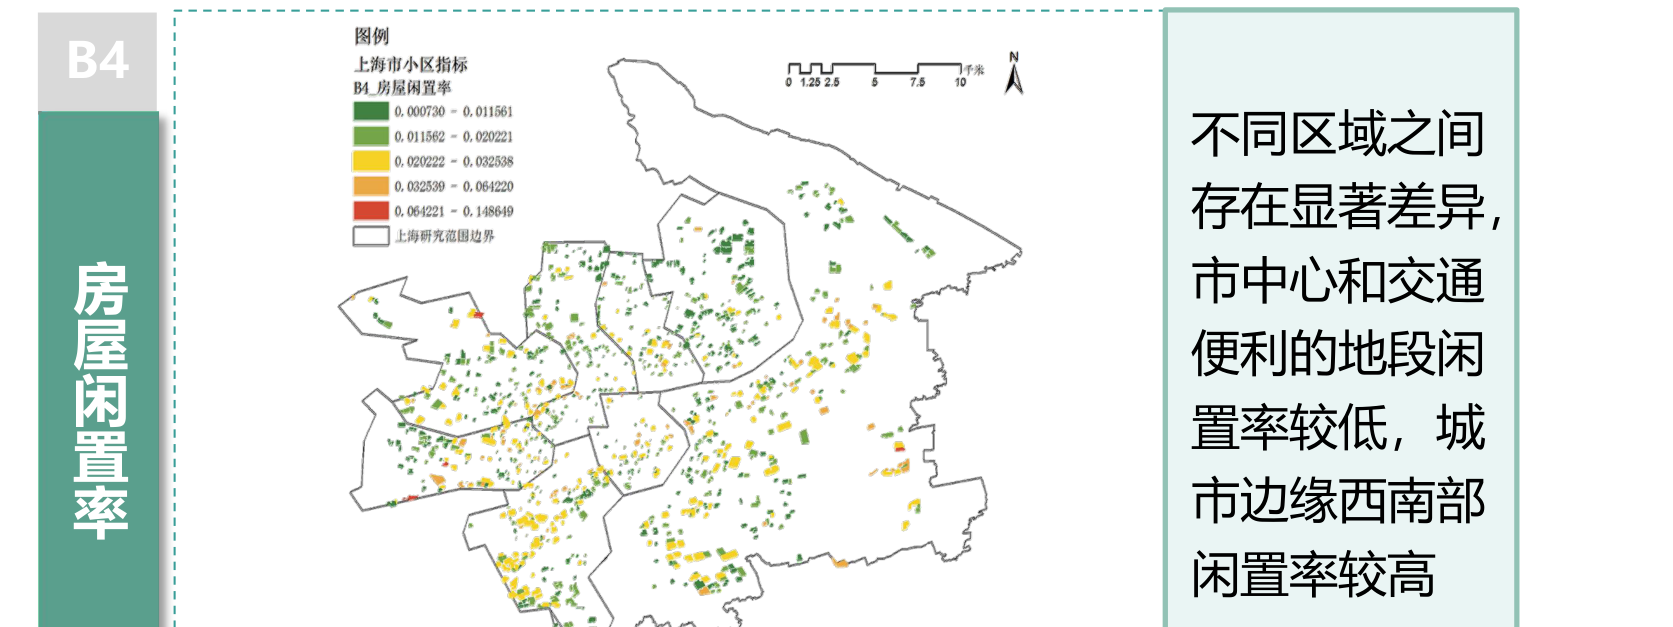
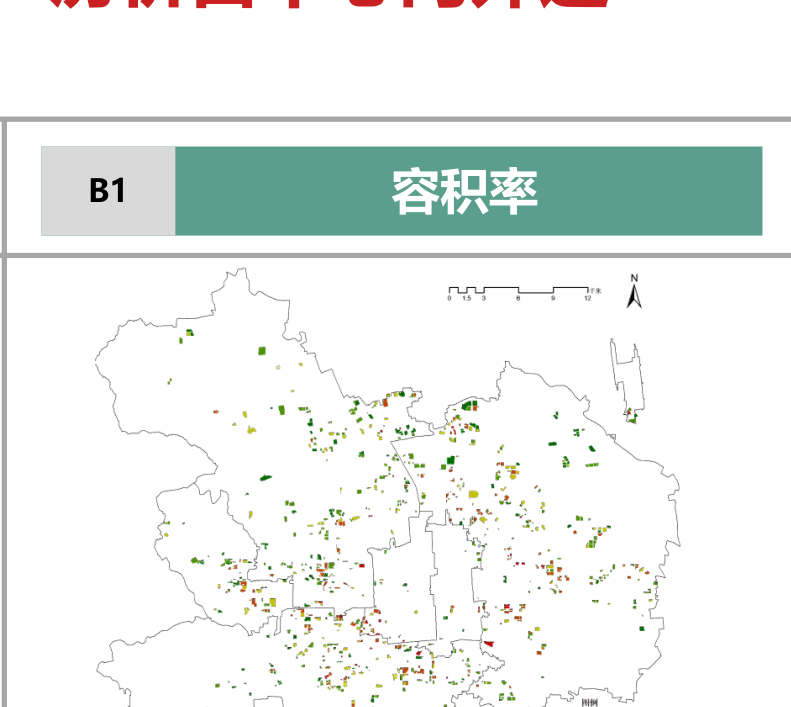
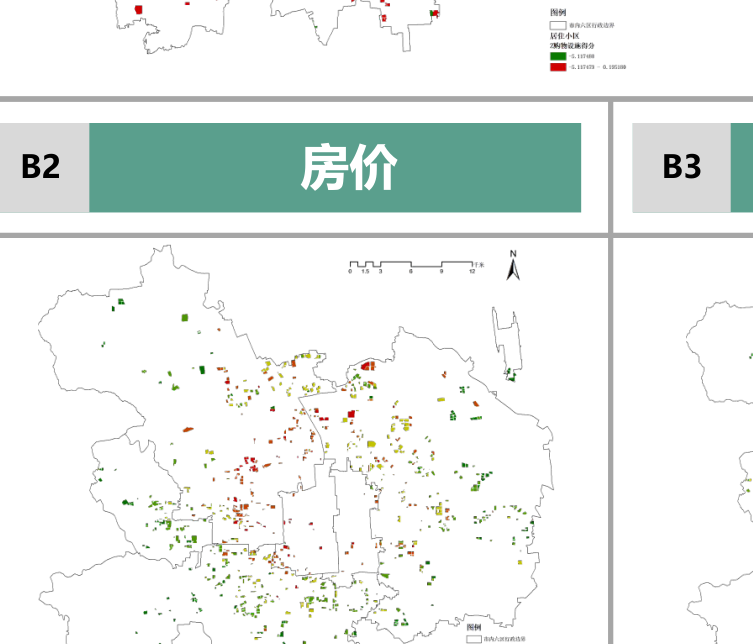
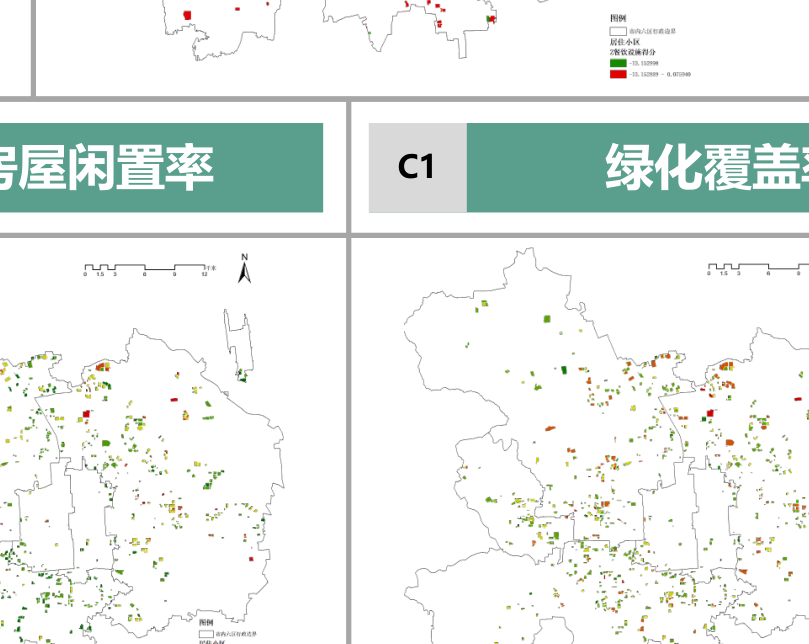
FAR is higher in the center and decreases outward; housing prices show a clear gradient; western and southern areas have higher vacancy rates; city center and convenient transit areas have lower vacancy rates.中心区容积率大,向四周递减;房价呈明显梯度;西部和南部闲置率高;市中心和交通便利地段闲置率较低

B1容积率
B2房价
B3物业费
B4闲置率
Ecological Benefit生态效益 C1 Green Coverage Rate绿化覆盖率 · C2 Air Pollution Index空气污染度

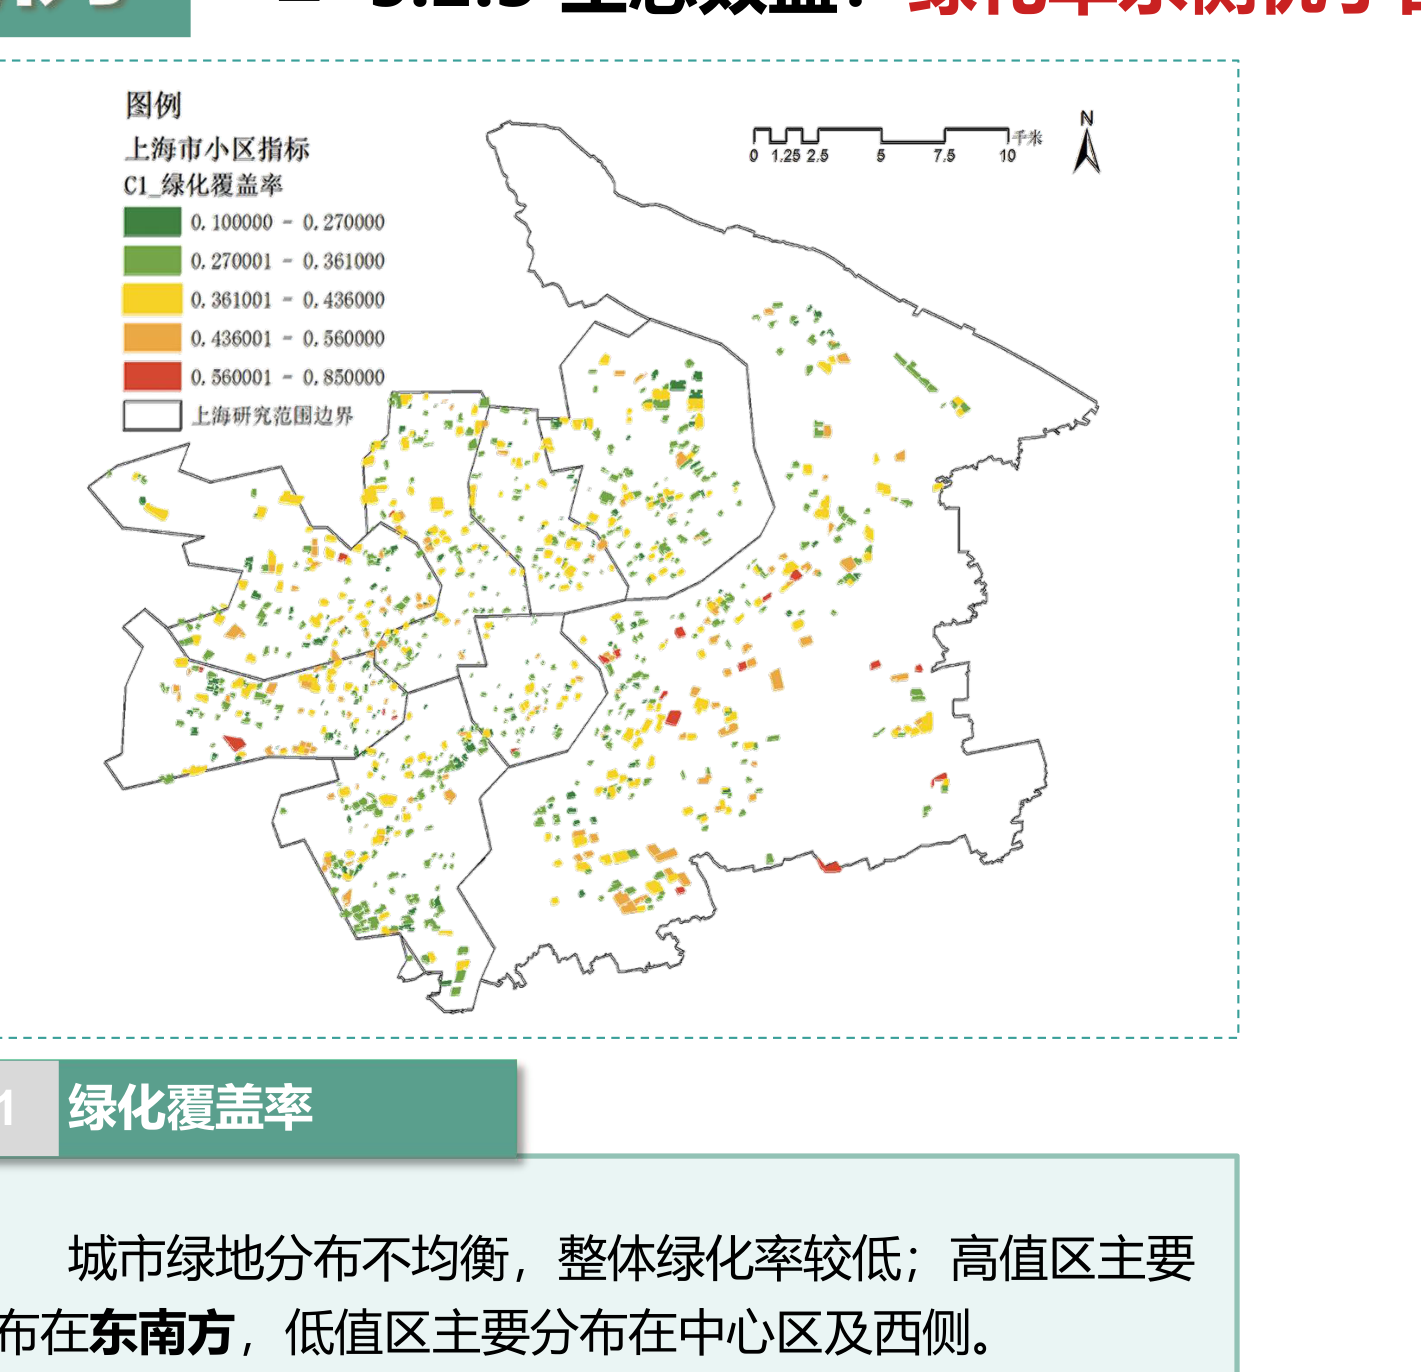
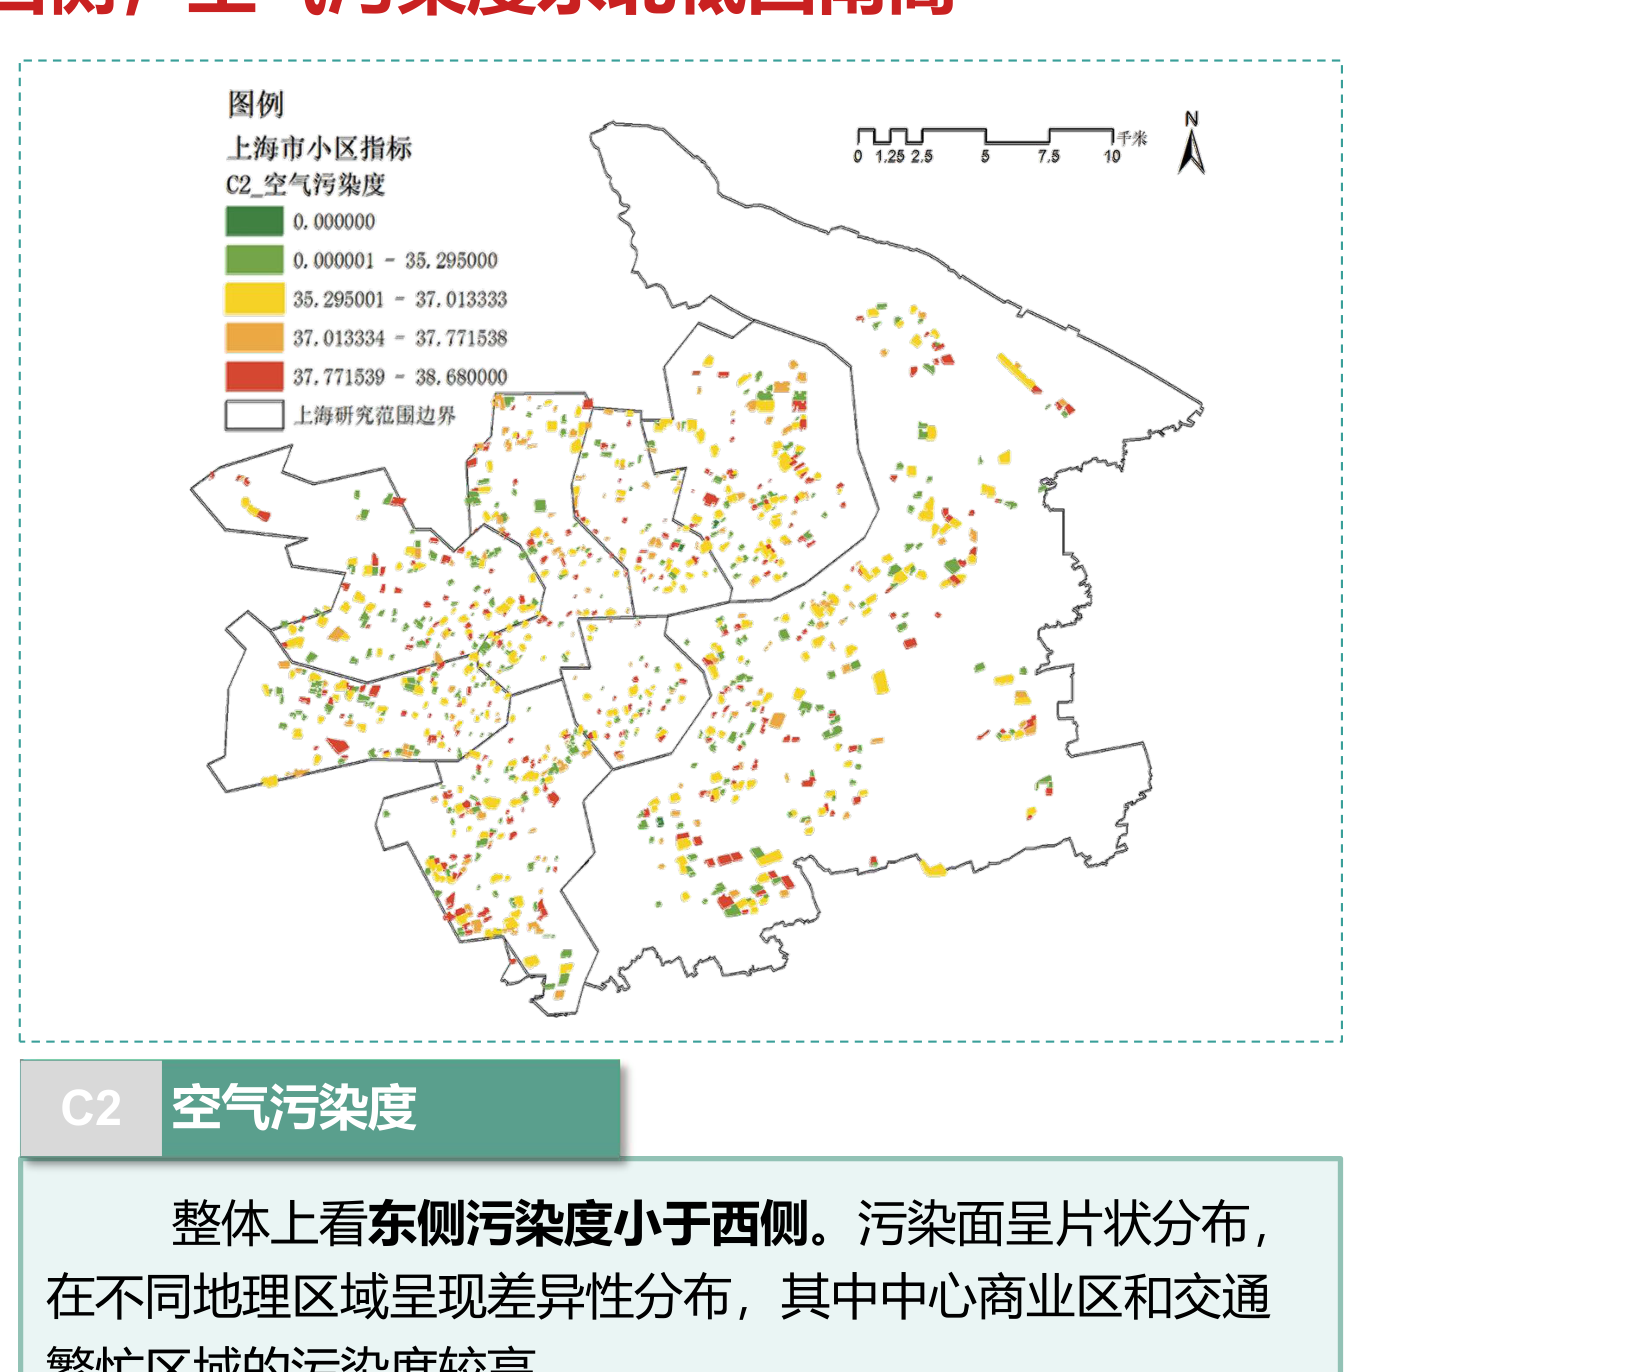
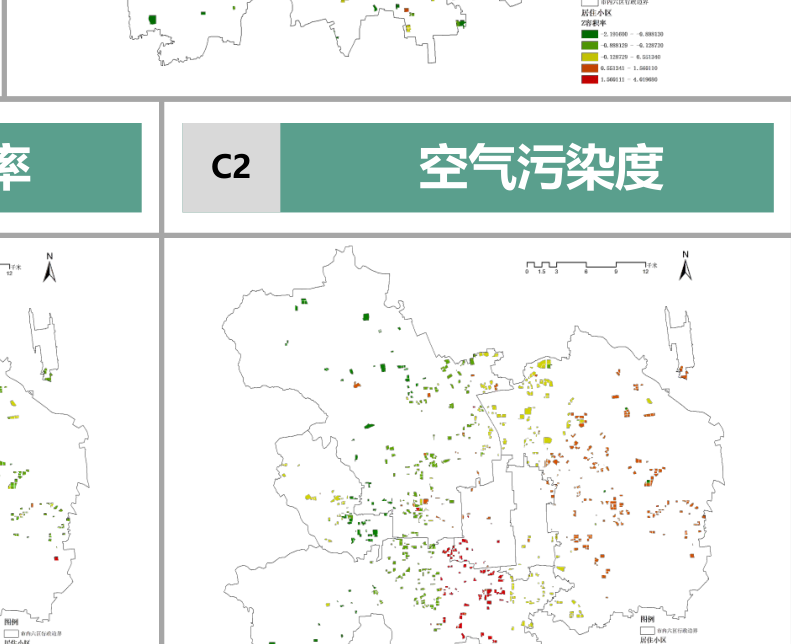
Green coverage is better on the east than west, with high values mainly in the southeast; air pollution is generally lower in the east than west, with higher pollution in central commercial and busy traffic areas.绿化率东侧优于西侧,高值主要在东南方;空气污染整体东侧低于西侧,中心商业区和交通繁忙区域污染较高

C1绿化覆盖率
C2空气污染度
Comprehensive Efficiency综合效率 Entropy-Weight TOPSIS Residential Land Comprehensive Efficiency Evaluation Results熵权 TOPSIS 住宅用地综合效率评价结果

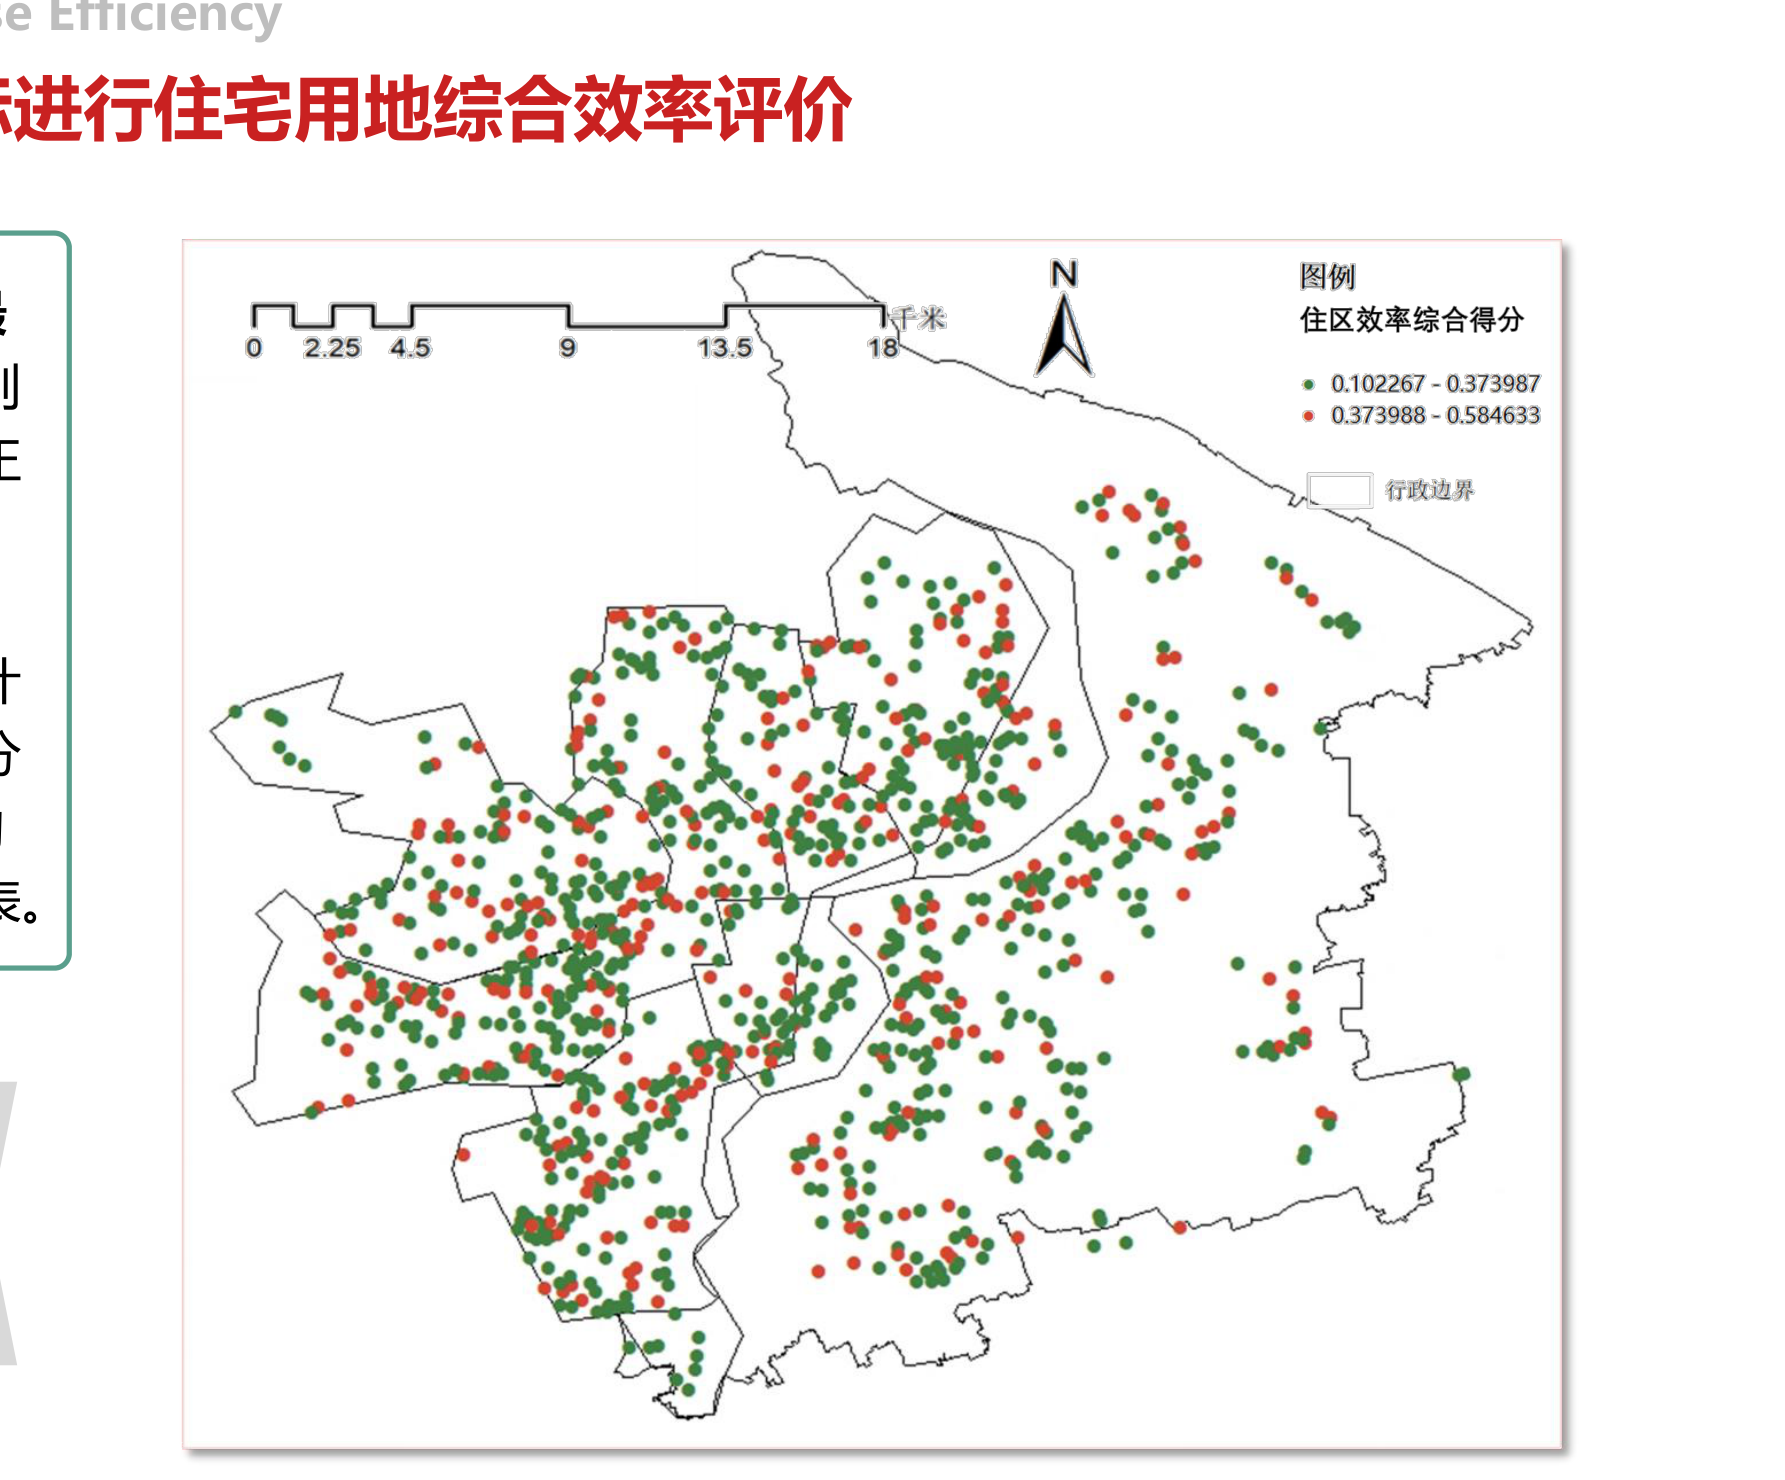
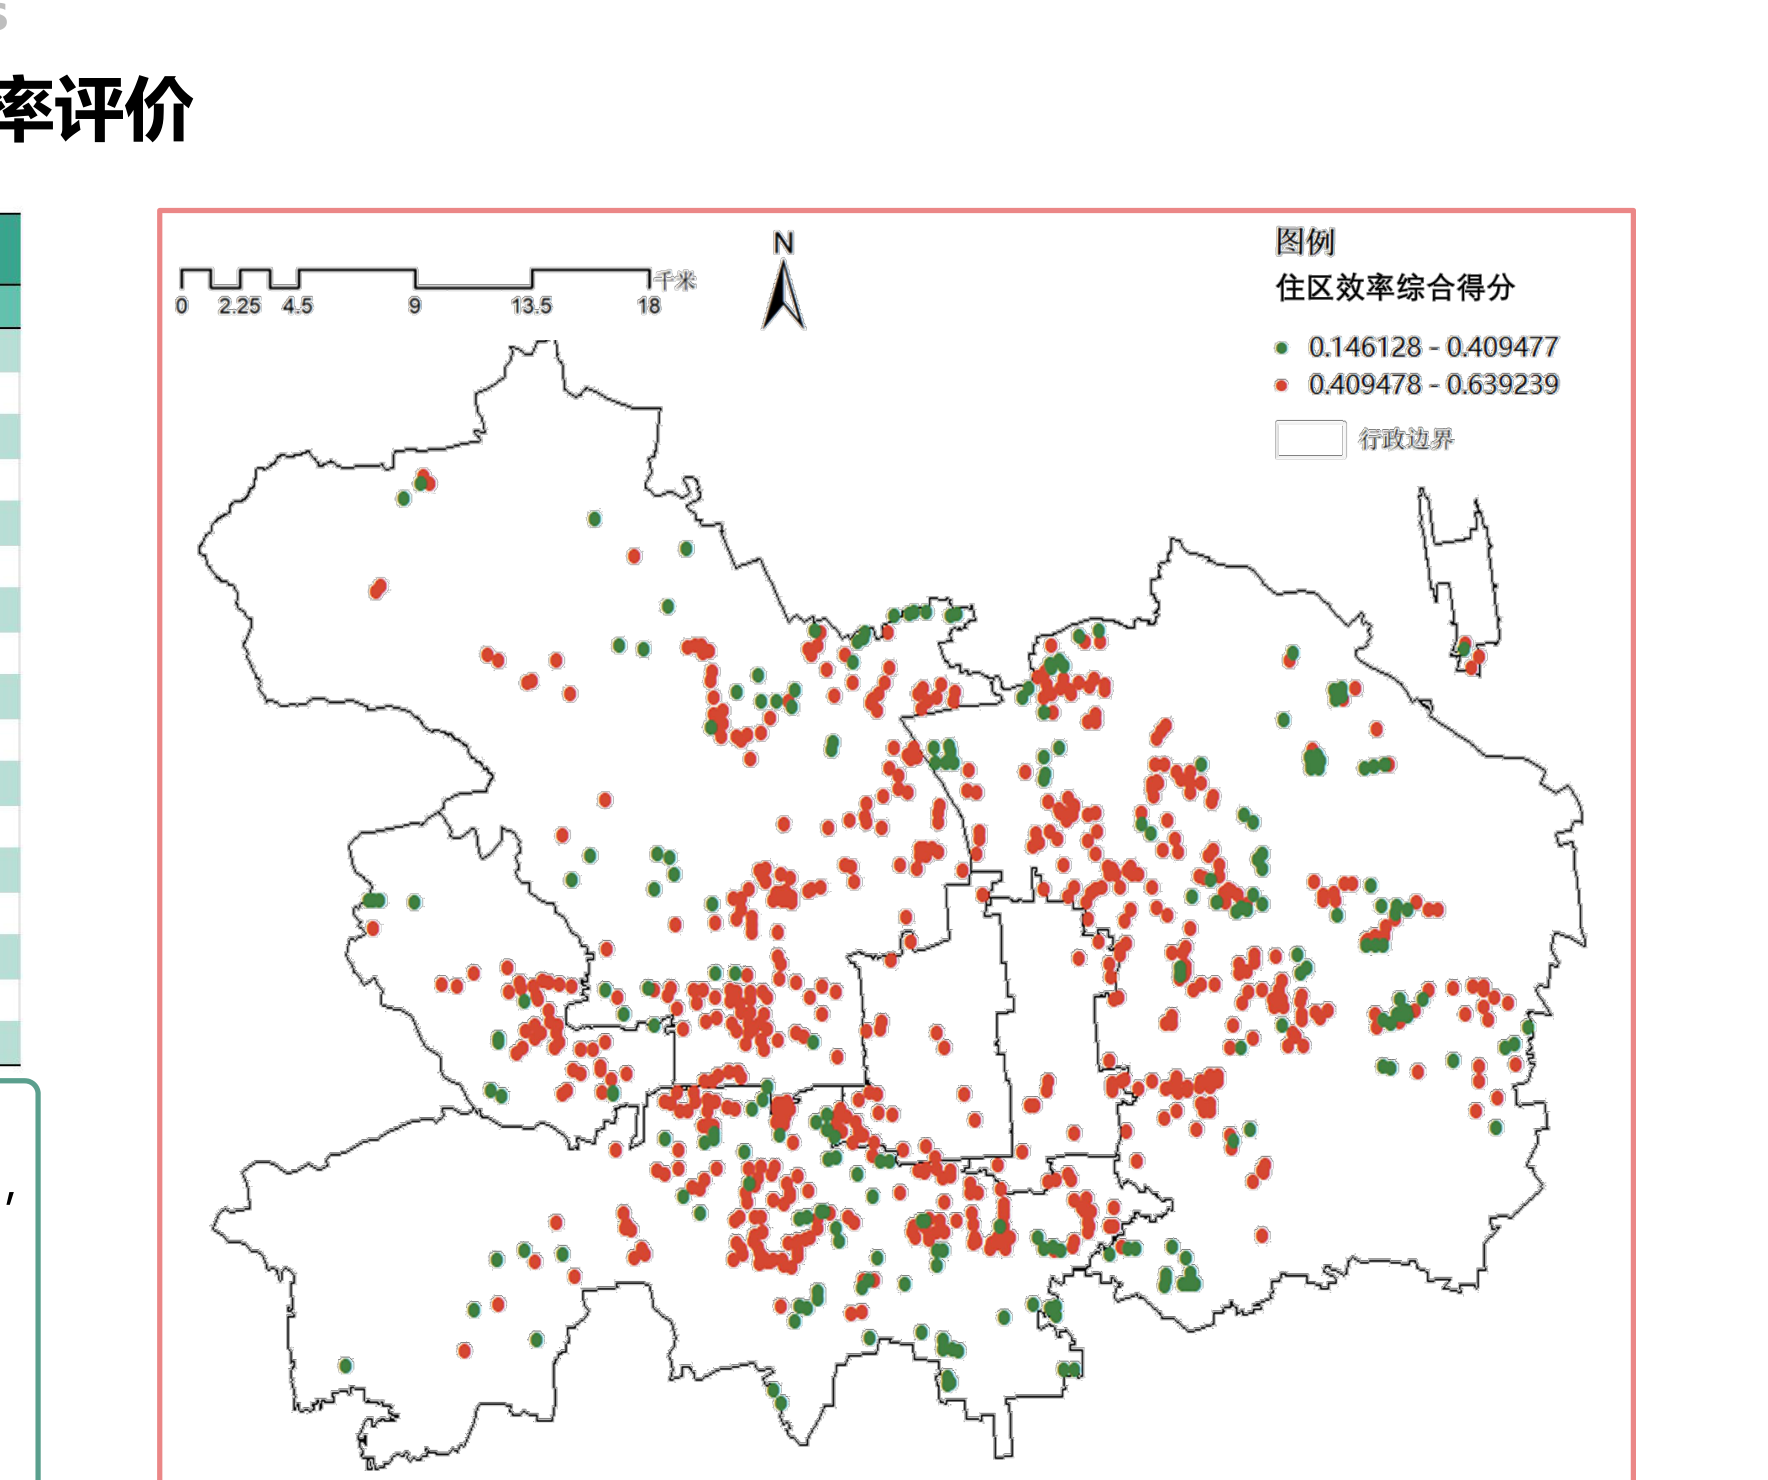
Coupled calculation based on 17 indicators, grouped by natural breaks. High-efficiency communities are more concentrated on the west side; low-efficiency communities cluster in the north-central and northwest areas.基于 17 个指标耦合计算,自然断点法分组。高效率住区分布在西侧多于东侧;低效率住区在中部偏北、偏西集中

Shanghai TOPSIS Comprehensive Efficiency / 上海TOPSIS综合效率
Happiness幸福感 Residents' Happiness GIS Spatial Distribution居民幸福感 GIS 空间分布

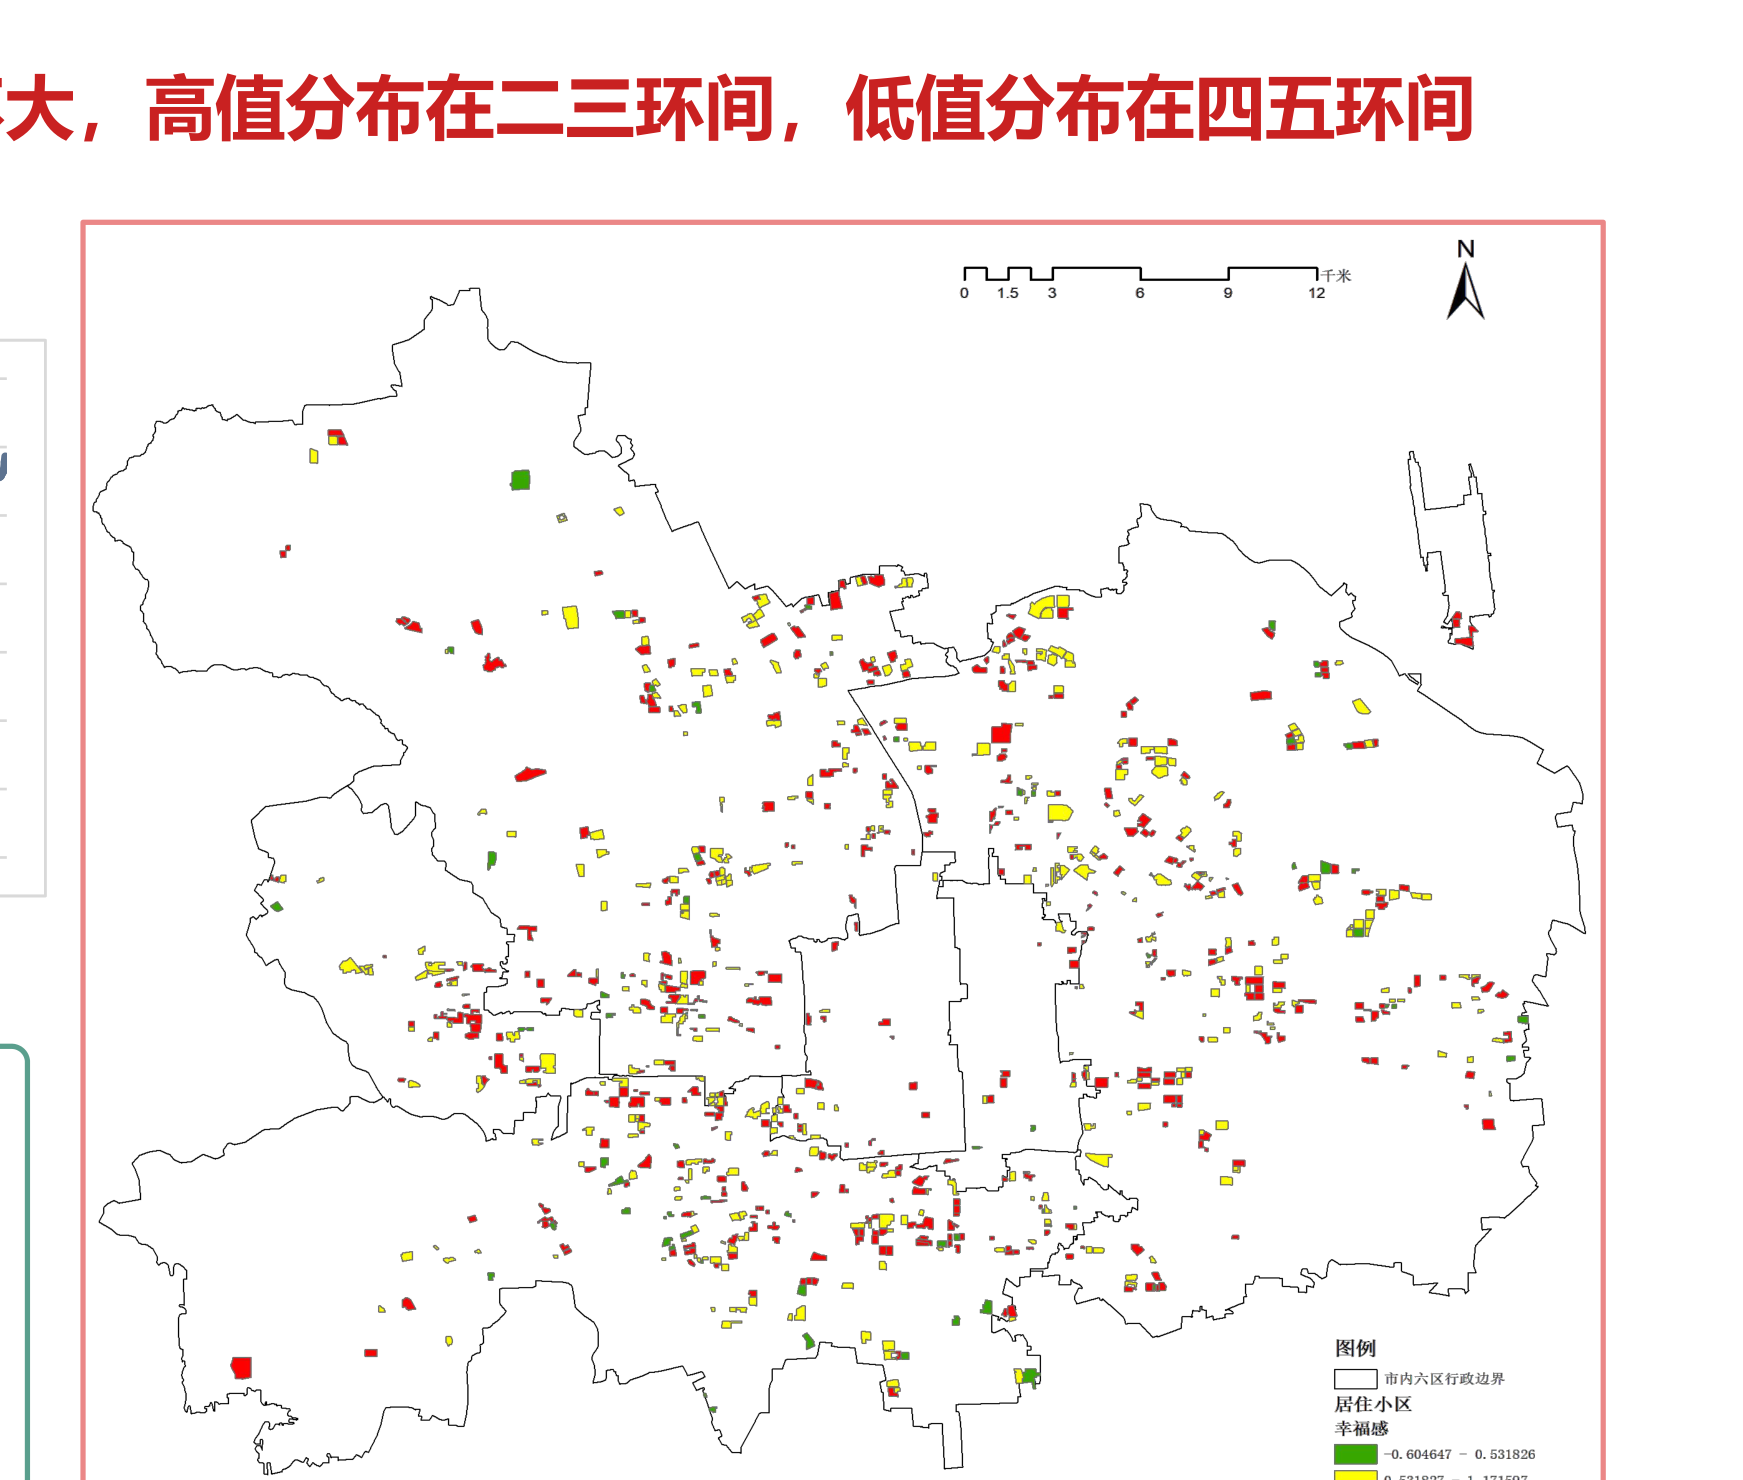
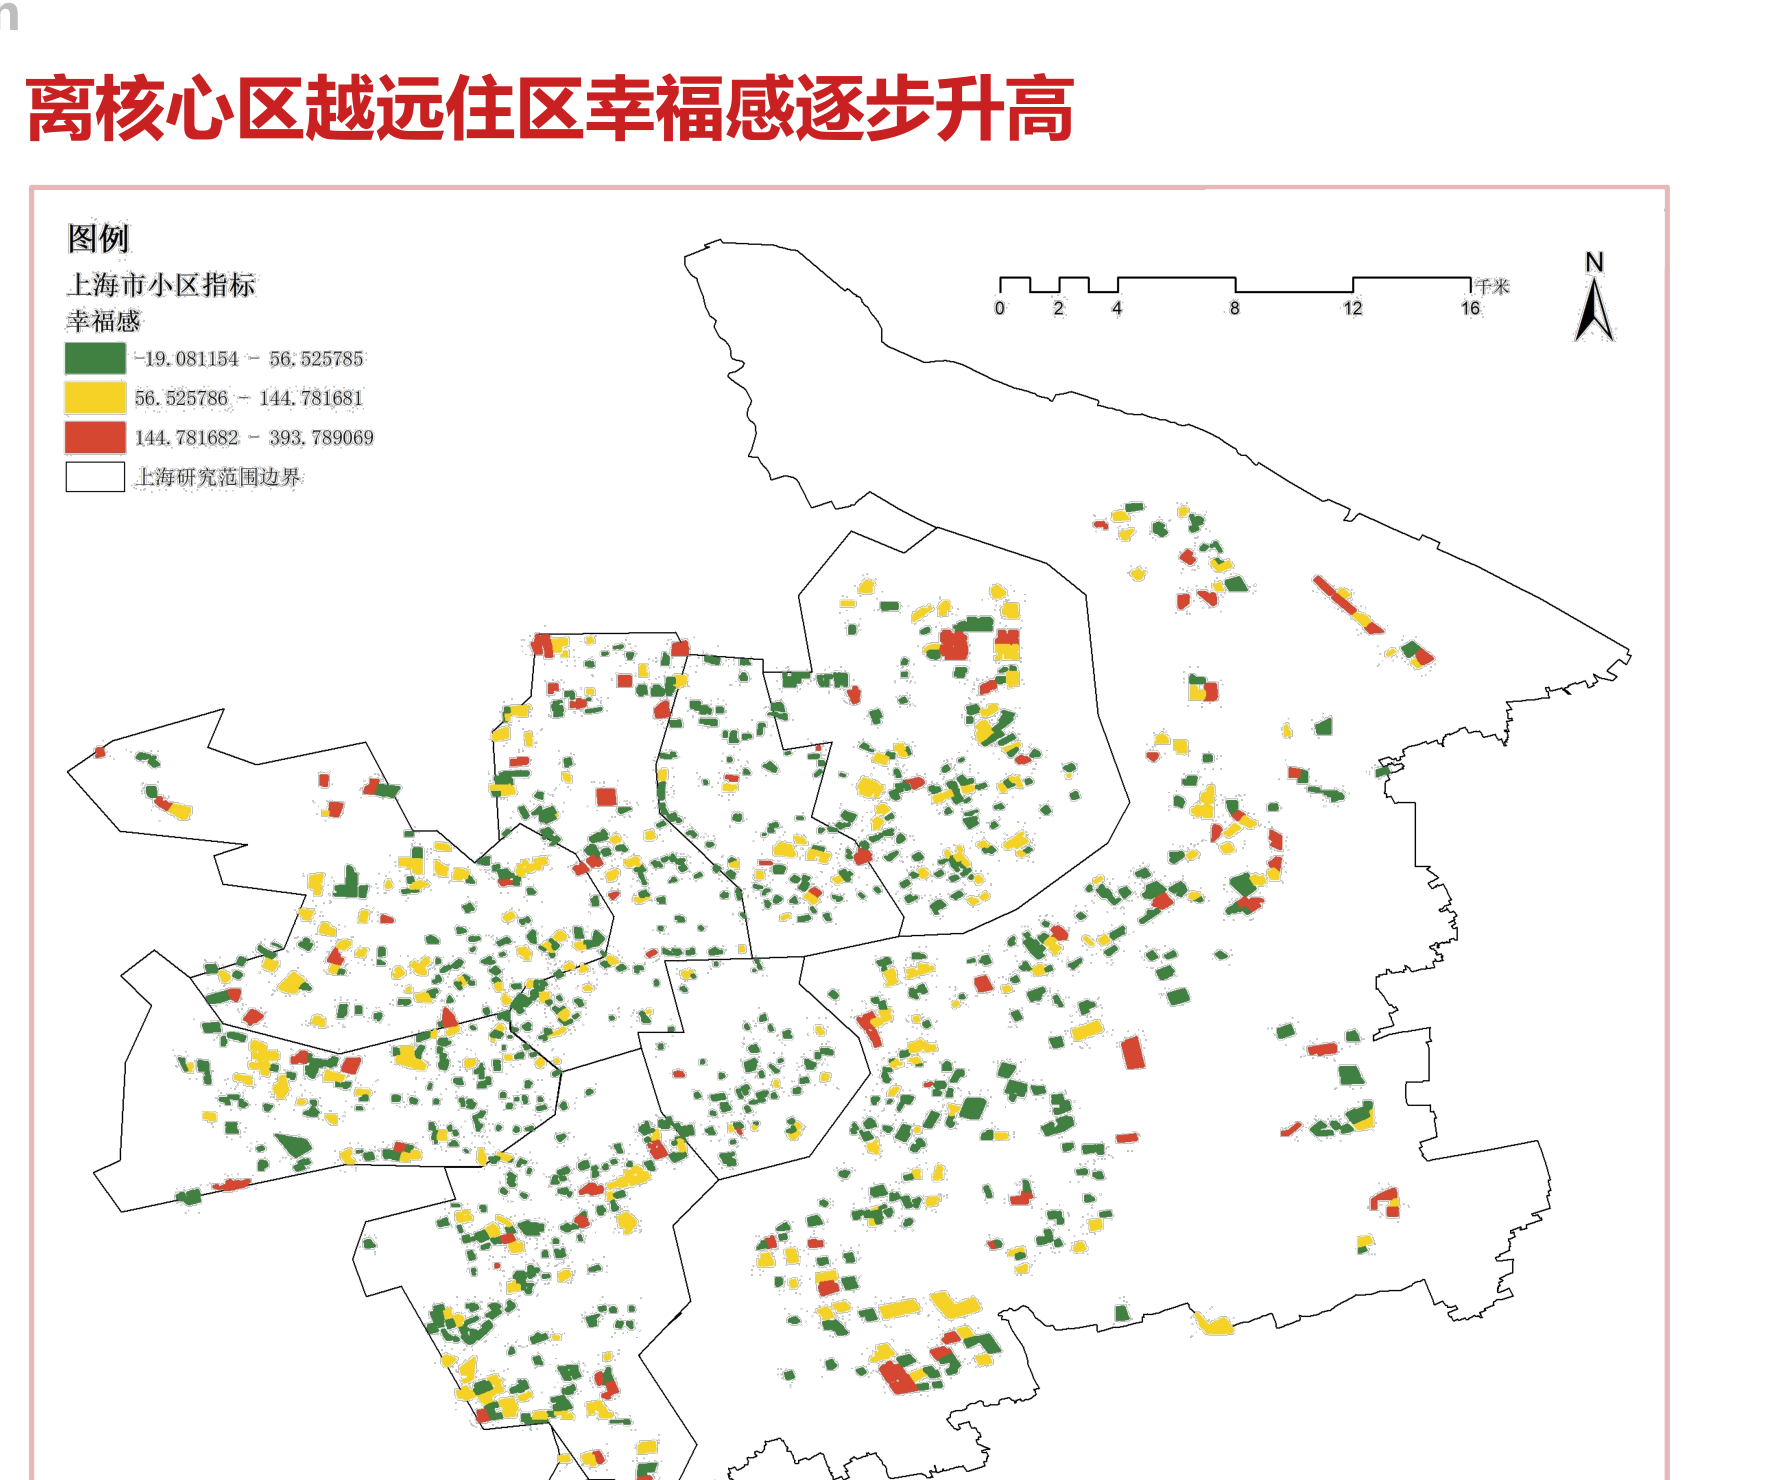
Baidu NLP sentiment analysis combined with GIS spatial interpolation. Core areas generally show lower happiness; the farther from the core, the higher the community happiness level.百度 NLP 情感分析结合 GIS 空间插值。核心区域幸福感普遍较低;离核心区越远,住区幸福感逐步升高

Shanghai Residents' Happiness / 上海居民幸福感
Social Benefit社会效益 A1–A8 Social Benefit Indicators (Construction Year / Per Capita Area / Vitality / Transit / Parks / Education / Medical / Elder Care)社会效益指标(建成年代 / 人均面积 / 活力度 / 交通 / 公园 / 教育 / 医疗 / 养老)

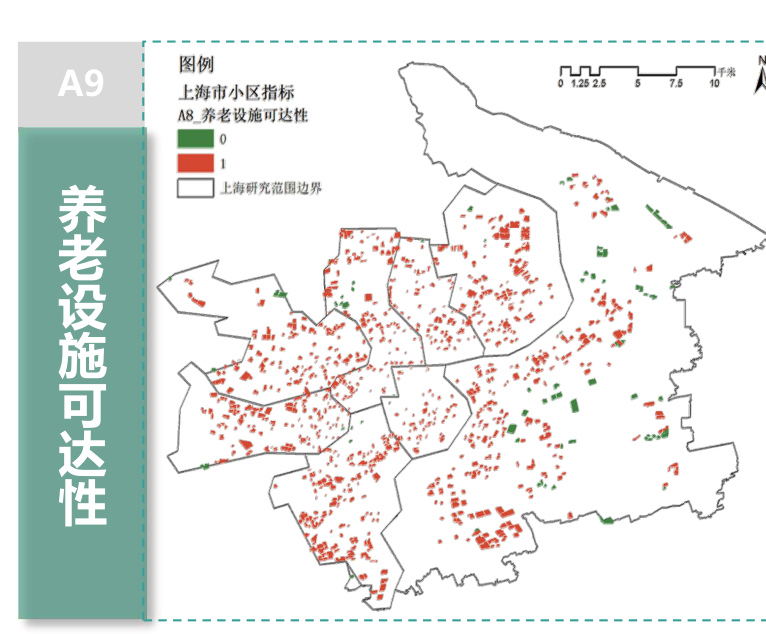
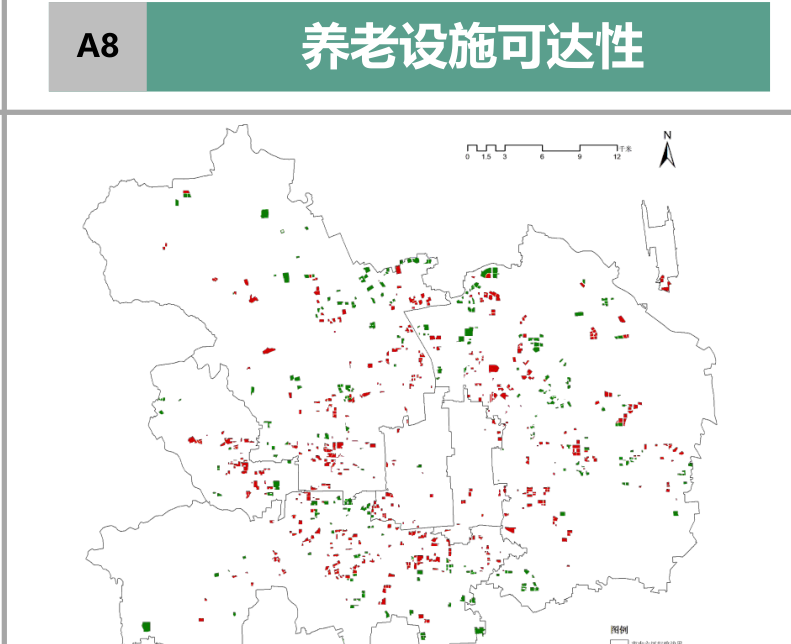
Transit accessibility decreases from city center outward, with the 4th ring road as the dividing line; education and medical follow the high-center pattern; elder care accessibility is generally good.交通场站可达性自市中心向外围递减,以四环为分水岭;教育、医疗基本符合中心高规律;养老设施可达性整体较好

A1建成年代
A2人均建筑面积
A3邻里活力度
A4交通场站
A5公园广场
A6教育设施
A7医疗设施
A8养老设施
Economic & Ecological Benefit经济效益 & 生态效益 A9–C1 (Shopping / Culture / Dining / FAR / Housing Price / Management Fee / Vacancy Rate / Green Coverage)(购物 / 文化 / 餐饮 / 容积率 / 房价 / 物业费 / 闲置率 / 绿化)

Southern areas have higher FAR; northwest has higher vacancy rates; housing prices decrease from center outward; green coverage is better in the north than south.南部容积率高,西北闲置率高,房价自中心向外递减;绿化率北侧优于南侧

A9购物设施
A10文化设施
A11餐饮设施
B1容积率
B2房价
B3物业费
B4闲置率
C1绿化覆盖率
Comprehensive Efficiency综合效率 TOPSIS Residential Land Comprehensive Efficiency Evaluation ResultsTOPSIS 住宅用地综合效率评价结果

High-efficiency communities cluster in ring-shaped distributions around the middle and outer ring roads, with lower housing prices, well-equipped medical and transit facilities, and abundant open spaces like parks and plazas.高效住区呈圈状集中分布在中环外环周边,具有房价较低、医疗交通设施完善、公园广场等开放空间丰富的特点

Beijing TOPSIS Comprehensive Efficiency / 北京TOPSIS综合效率
Happiness幸福感 Residents' Happiness GIS Spatial Distribution居民幸福感 GIS 空间分布

Happiness is highest between the 2nd and 3rd ring roads, especially in the northwest; a notable low-value cluster appears between the 4th and 5th ring roads in the southwest (dense urban village belt).二环和三环之间幸福感最高,西北侧尤为显著;西南侧四环与五环之间出现明显低值集聚区域(城中村密集带)

Beijing Residents' Happiness / 北京居民幸福感
08 · Model Performance

Model Performance Evaluation模型效果评估

The XGBoost model shows better fitting performance on the Beijing dataset; model convergence validates the effectiveness of the research methodology.XGBoost 模型在北京市数据集上表现出更佳的拟合效果,模型收敛验证了研究方法的有效性。

Shanghai (Overall)上海市(整体)

0.25
MAE (Test Set)(测试集)
Mean Absolute Error平均绝对误差
0.33
RMSE (Test Set)(测试集)
Root Mean Squared Error均方根误差
0.38
(Train Set)(训练集)
Coefficient of Determination决定系数

Beijing (High-Efficiency Communities)北京市(高效率住区)

0.26
MAE (Test Set)(测试集)
Mean Absolute Error平均绝对误差
0.34
RMSE (Test Set)(测试集)
Root Mean Squared Error均方根误差
0.23
(Test Set)(测试集)
Coefficient of Determination决定系数
09 · Innovation Points

Innovation Points & Application Prospects创新点与应用前景

Breakthrough innovations across three dimensions — evaluation indicators, sentiment measurement methods, and correlation analysis methods — with broad practical application value.在评价指标、情绪测度方法和相关性分析方法三个维度实现创新突破,具有广泛的实践应用价值。

Innovation 01创新点 01

Targeted Residential Land Efficiency Evaluation Indicators针对性住宅用地效率评价指标

A customized indicator system was tailored to Beijing's characteristics of frequent population mobility and residents' focus on public service facilities. High-precision new big data sources such as mobile signaling and environmental monitoring station data were introduced for measurement, making the research more targeted than traditional studies.针对北京市人口流动频繁、居民更关注各类公共服务配套设施的特点定制指标体系,引入手机信令、环境监测站数据等高精度新型大数据进行测度,相比传统研究更具针对性。

Innovation 02创新点 02

Wide-Coverage Resident Sentiment Measurement Method广覆盖的居民情绪测度方法

Massive online social text data (Weibo + Douyin) with wide coverage was adopted, breaking through the bottleneck of small sample sizes and limited coverage of traditional questionnaire surveys. The Baidu PaddlePaddleNLP model, which provides strong support for Chinese text semantic analysis, was used for sentiment classification.采用可覆盖范围广的海量网络社交文本数据(微博 + 抖音),突破传统问卷调查样本量小、覆盖范围有限的瓶颈,并使用对中文文本语义分析支持良好的百度 PaddlePaddleNLP 模型进行情感判别。

Innovation 03创新点 03

Advanced Correlation Analysis Methods先进的相关性分析方法

Simple multiple linear regression was abandoned in favor of the XGBoost model, which handles medium-to-low dimensional data and regression problems with higher accuracy. The TreeSHAP model was introduced for interpretability analysis, making the research conclusions more persuasive.摒弃简单的多元线性回归,采用能有效处理中低维数据和回归问题且准确度更高的 XGBoost 模型,并引入 TreeSHAP 模型对其进行可解释性分析,使研究结论更具说服力。

Application Prospects应用前景

🏗️

Macro · Residential Happiness Prediction宏观·住区幸福感预测

Used for site selection evaluation of planned new residential communities, observing the likely happiness impact on residents after construction, to select the optimal location.用于计划新建住区的选址评估,观测各住区建成后可能给居民带来的幸福感影响,从而选取最佳区位

🔄

Meso · Aging Neighborhood Renewal Priority中观·老旧住区更新优先级

Evaluate the happiness status of existing communities and rank aging neighborhood renewal priorities from a humanistic perspective, driving progressive renewal.评估已有住区的幸福感情况,从人本主义视角划分老旧住区更新的优先程度,推动渐进式更新

🎯

Micro · Targeted Renewal Strategies微观·针对性更新策略

Identify the environmental or social elements that should be prioritized when renewing communities in the target city, creating more targeted renewal strategies.明确目标城市住区更新时应重点关注的环境或社会要素,打造更具针对性的更新策略

📐

Planning · New Residential Design Directions规划·新建住区设计方向

Identify the most important social or environmental elements for new communities in the target city, providing data-driven directions for residential area planning and design.明确目标城市新建住区时最需关注的社会或环境要素,为居住区规划设计提供数据驱动的方向

10 · Research Team

Research Team研究团队

School of Architecture, Tianjin University天津大学建筑学院
School of Intelligence and Computing, Tianjin University天津大学智能与计算学部
郭雅洁
Architecture建筑学院
郭函祎
Architecture建筑学院
林昂
Architecture建筑学院
孙浩楠
Architecture建筑学院
罗静宜
Architecture建筑学院
苏琪
Architecture建筑学院
崔馨元
Architecture建筑学院
王若凡
Architecture建筑学院
顾凌峭
Intelligence & Computing智能计算学部