Urban Planning · Big Data Analysis · Emotion Geography 城市规划 · 大数据分析 · 情绪地理学

Urban Sentiment Spatio-temporal Analysis 城市情绪时空分析

Using Weibo check-in message data and Baidu Search Index time series, this research explores the spatial and temporal patterns of emotional expression across four municipalities — Beijing, Tianjin, Shanghai, and Chongqing — from both spatial and temporal perspectives. 基于微博打卡留言数据与百度指数时间序列,从空间时间双视角解析北京、天津、上海、重庆四座城市的情绪分布规律。

Weibo Check-in Data微博打卡数据 Baidu Index Time Series百度指数时序 ArcGIS Spatial VisualizationArcGIS空间可视化 NLP Sentiment ClassificationNLP情感分类 STL Decomposition · Correlation AnalysisSTL分解 · 相关性分析

Research Overview 研究概述

Project Background & Objectives 项目背景与目标

With the widespread adoption of social media, urban residents leave vast amounts of geo-tagged emotional expressions on platforms like Weibo. This study uses Weibo check-in messages as its spatial data source and Baidu Search Index keyword volumes as its temporal data source to conduct a spatio-temporal sentiment analysis across four municipalities. 随着社交媒体的普及,城市居民在微博等平台上留下海量带有地理标签的情绪表达。本研究以微博打卡留言为空间数据源,以百度指数关键词搜索量为时间数据源,对四个直辖市进行情绪时空分析。

Emotions are classified into five categories — Joy, Anger, Sadness, Disgust, and Fear. ArcGIS is used to generate district-level sentiment distribution maps, while word frequency statistics and word cloud visualizations reveal emotional characteristics of each city. Time series analysis further explores the periodic patterns of emotional fluctuation. 研究将情绪分为乐、怒、哀、恶、惧五类,借助ArcGIS生成各区县情绪分布图,结合词频统计与词云可视化揭示各城市的情绪特征,并通过时间序列分析探索情绪波动的周期性规律。

Key findings: Northern suburban areas show generally more positive emotions, while core urban districts exhibit higher levels of negative sentiment. Work pressure, pandemic impacts, and urban infrastructure issues are the primary drivers of emotional fluctuation. 研究发现:北部郊区整体情绪较积极,核心城区消极情绪偏高;工作压力、疫情影响与城市基础设施问题是情绪波动的主要驱动力。

Core Research Questions: Do emotions exhibit spatial distribution patterns across different urban areas? What periodic characteristics do emotional keyword time series display? 核心问题:城市不同地区的情绪是否存在空间分布规律?情绪关键词的时间序列呈现怎样的周期性特征?
4
Cities Analyzed分析城市
5
Emotion Categories情绪类别
128
Baidu Index Keywords百度指数关键词
2
Data Dimensions数据维度

Research Team研究团队

叶薪悦 陈萌 柳心怡 崔馨元 李澍堉
Advisors:指导老师: 张天洁  ·  崔博庶  ·  张孝贤
Institution:机构: Tianjin University天津大学

Emotion Classification System 情绪分类体系

Five-Dimensional Emotion Framework 五维情绪框架

Joy (Joy / 乐)
Anger (Anger / 怒)
Sadness (Sadness / 哀)
Disgust (Disgust / 恶)
Fear (Fear / 惧)

Using a pre-trained ChatGPT model, Weibo texts are classified into five emotion categories. The emotion proportions for each district are extracted and imported into ArcGIS for spatial-level visualization. For the Baidu Index data, correlation tests are used to identify the dominant emotion type for each keyword. 通过预训练的 ChatGPT 模型,对微博文本进行五情绪分类,提取各城市各区县的情绪占比,并导入 ArcGIS 进行空间等级可视化。百度指数端则通过相关性检验确定各关键词的主导情绪类型。


Research Design 研究设计

Technical Methodology 技术路线

技术路线图
Dual-track parallel architecture: Left — Weibo check-in data stream (spatial perspective) → data crawling · emotion annotation · ArcGIS visualization · word clouds; Right — Baidu Index time series stream (temporal perspective) → keyword library construction · statistical analysis · STL decomposition · correlation testing. 双轨并行架构:左侧微博打卡数据流(空间角度)→ 数据爬取 · 情绪标注 · ArcGIS可视化 · 词云;右侧百度指数时间序列流(时间角度)→ 关键词库构建 · 统计分析 · STL分解 · 相关性检验
Spatial Dimension · Weibo Check-in 空间维度 · 微博打卡

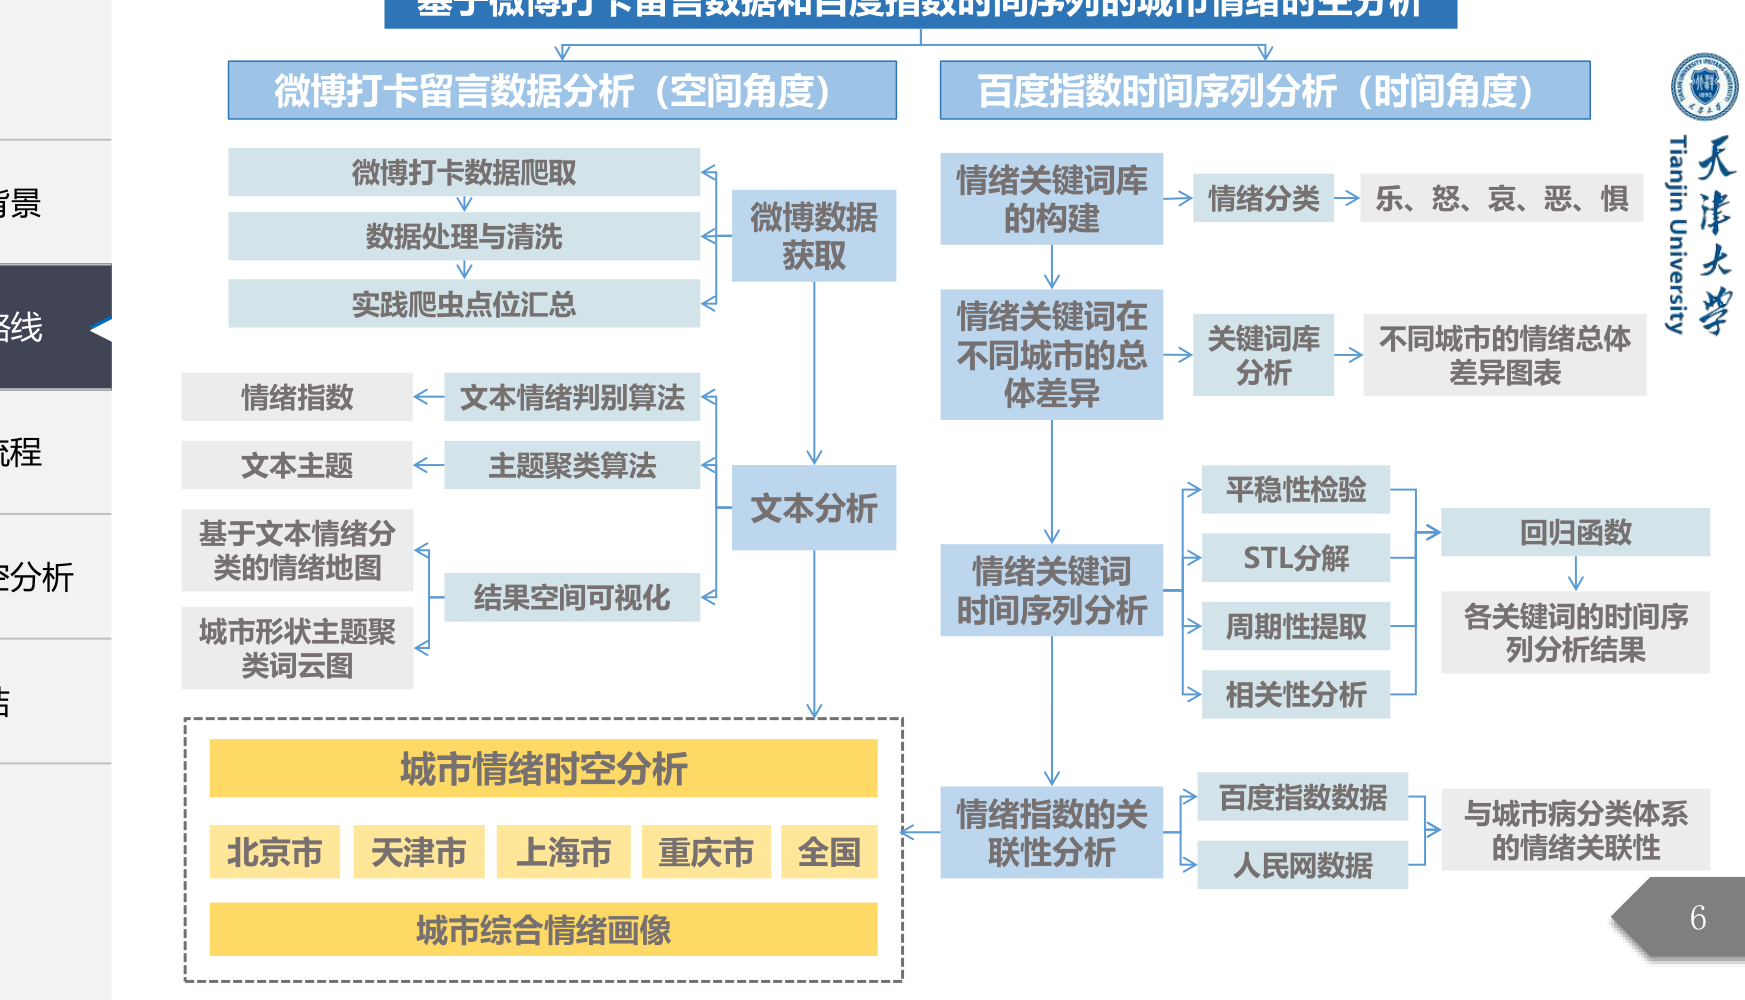
Weibo Data Processing Pipeline微博数据处理流程

  • 1
    Data Crawling:数据爬取: Scrape check-in coordinates and message texts from Tianjin districts 抓取天津各区打卡坐标及留言文本
  • 2
    Cleaning & Deduplication:清洗去重: Remove duplicate entries and align with check-in coordinates 去除重复条目,对应打卡坐标
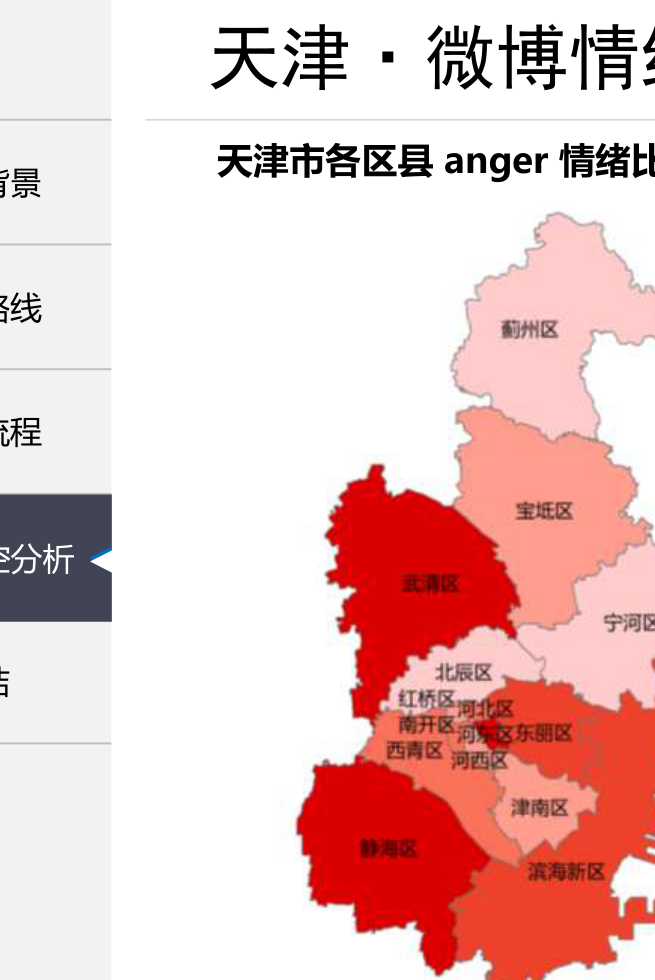
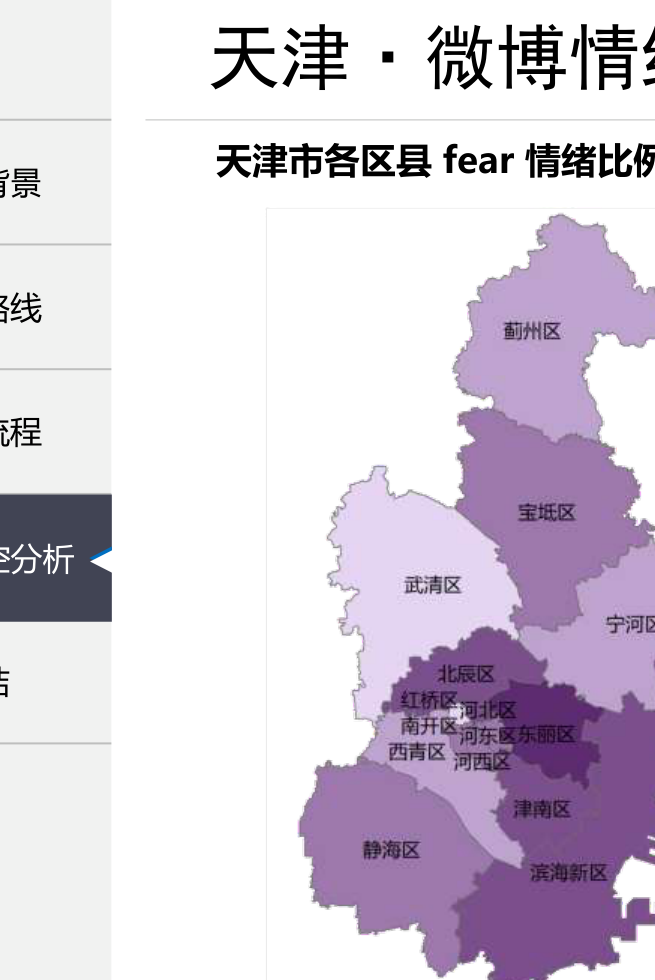
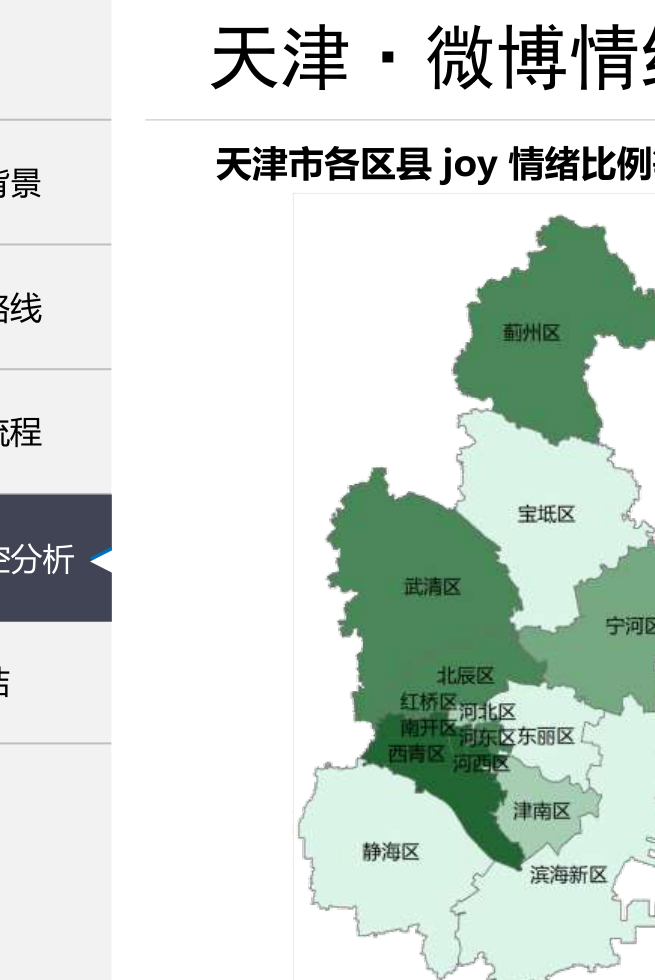
  • 3
    Emotion Classification:情绪判别: ChatGPT model outputs joy / sadness / anger / love / fear labels ChatGPT模型输出 joy / sadness / anger / love / fear 标签
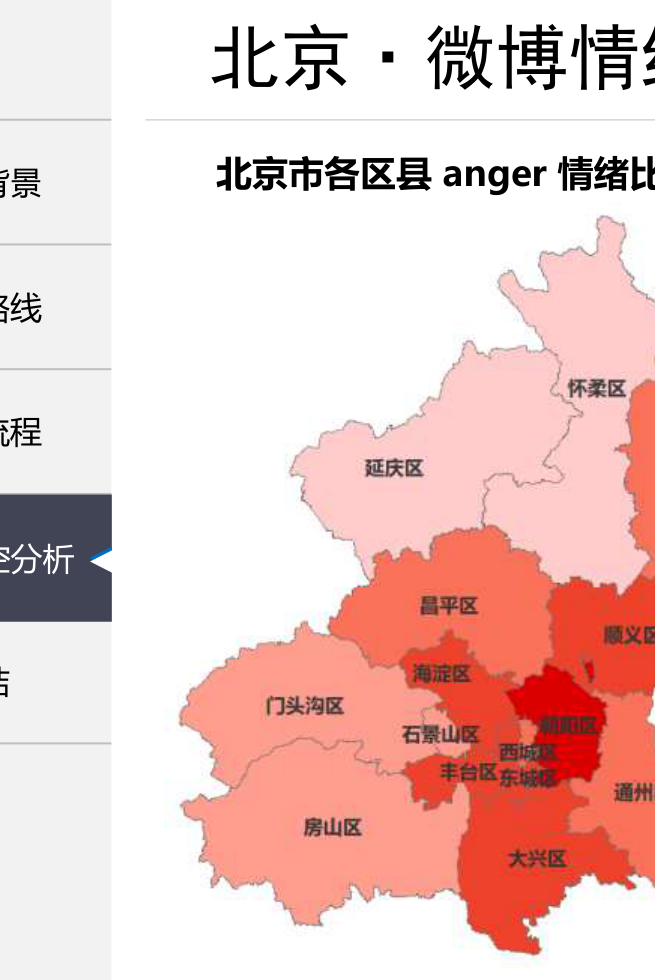
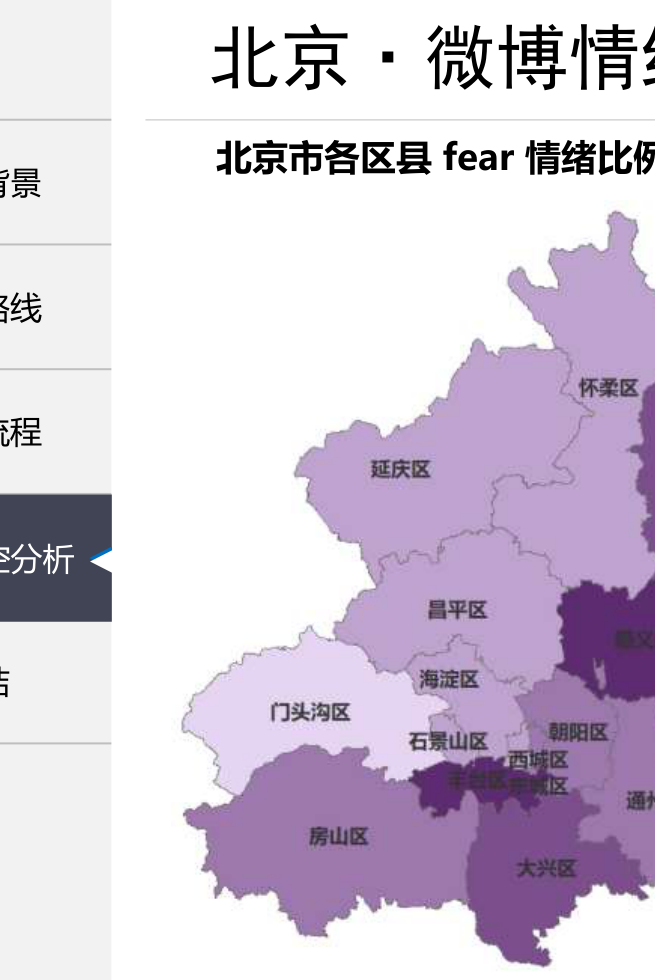
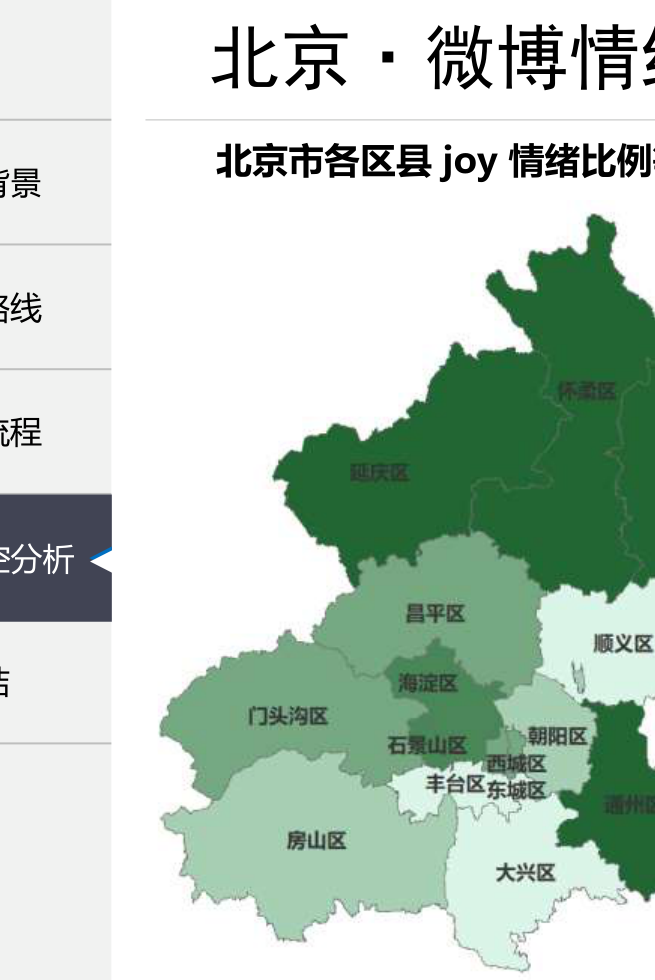
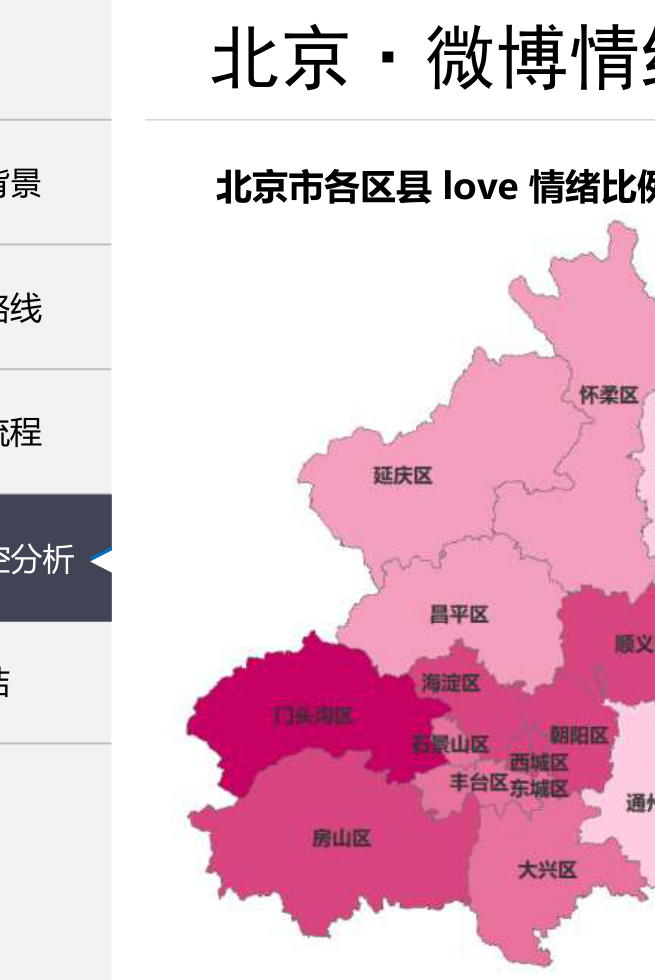
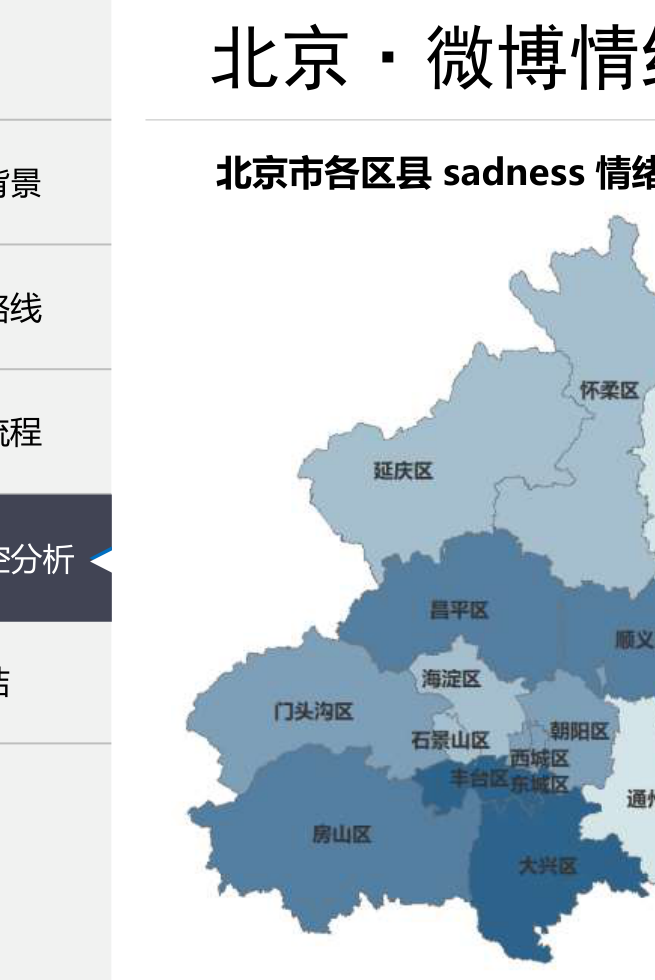
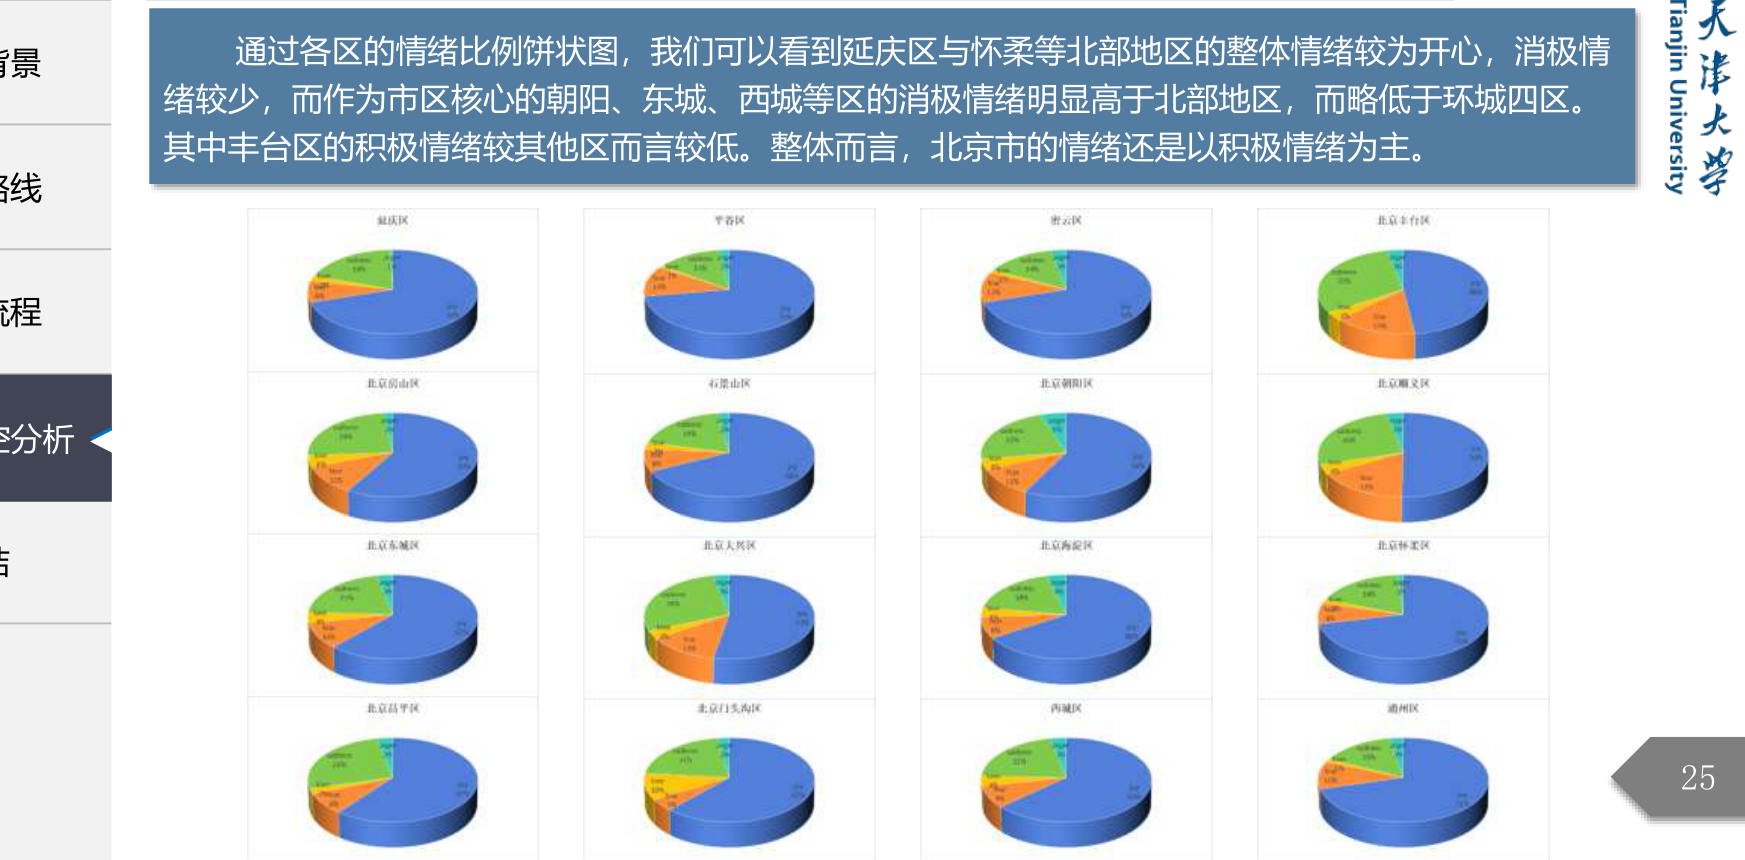
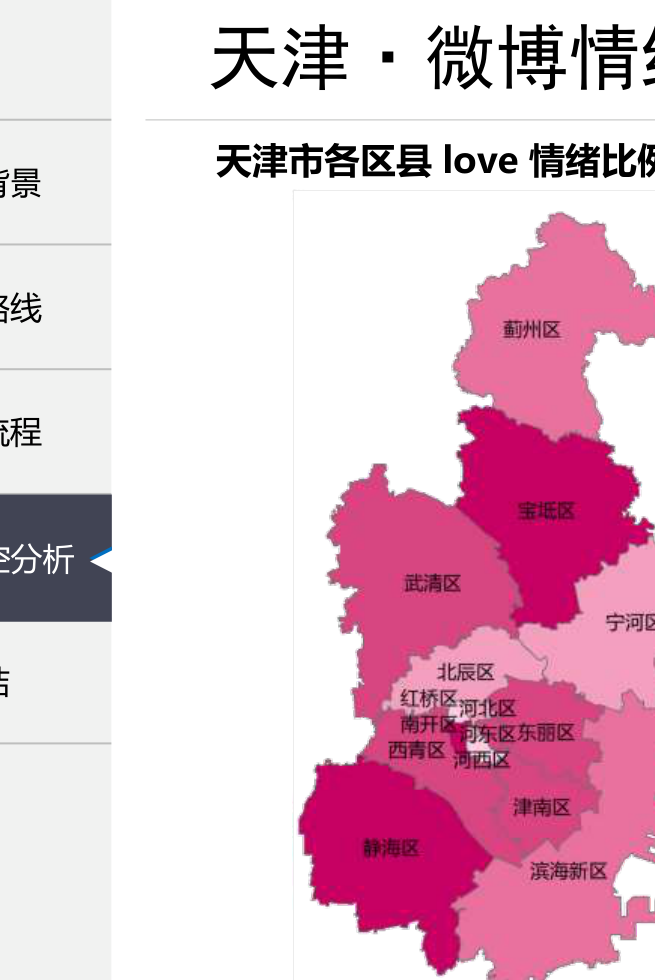
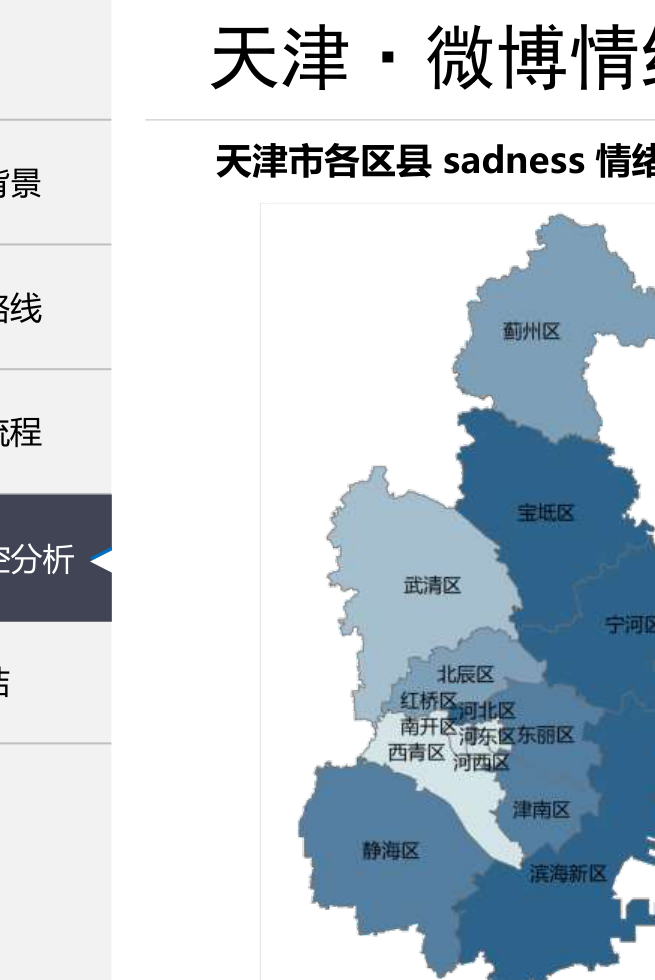
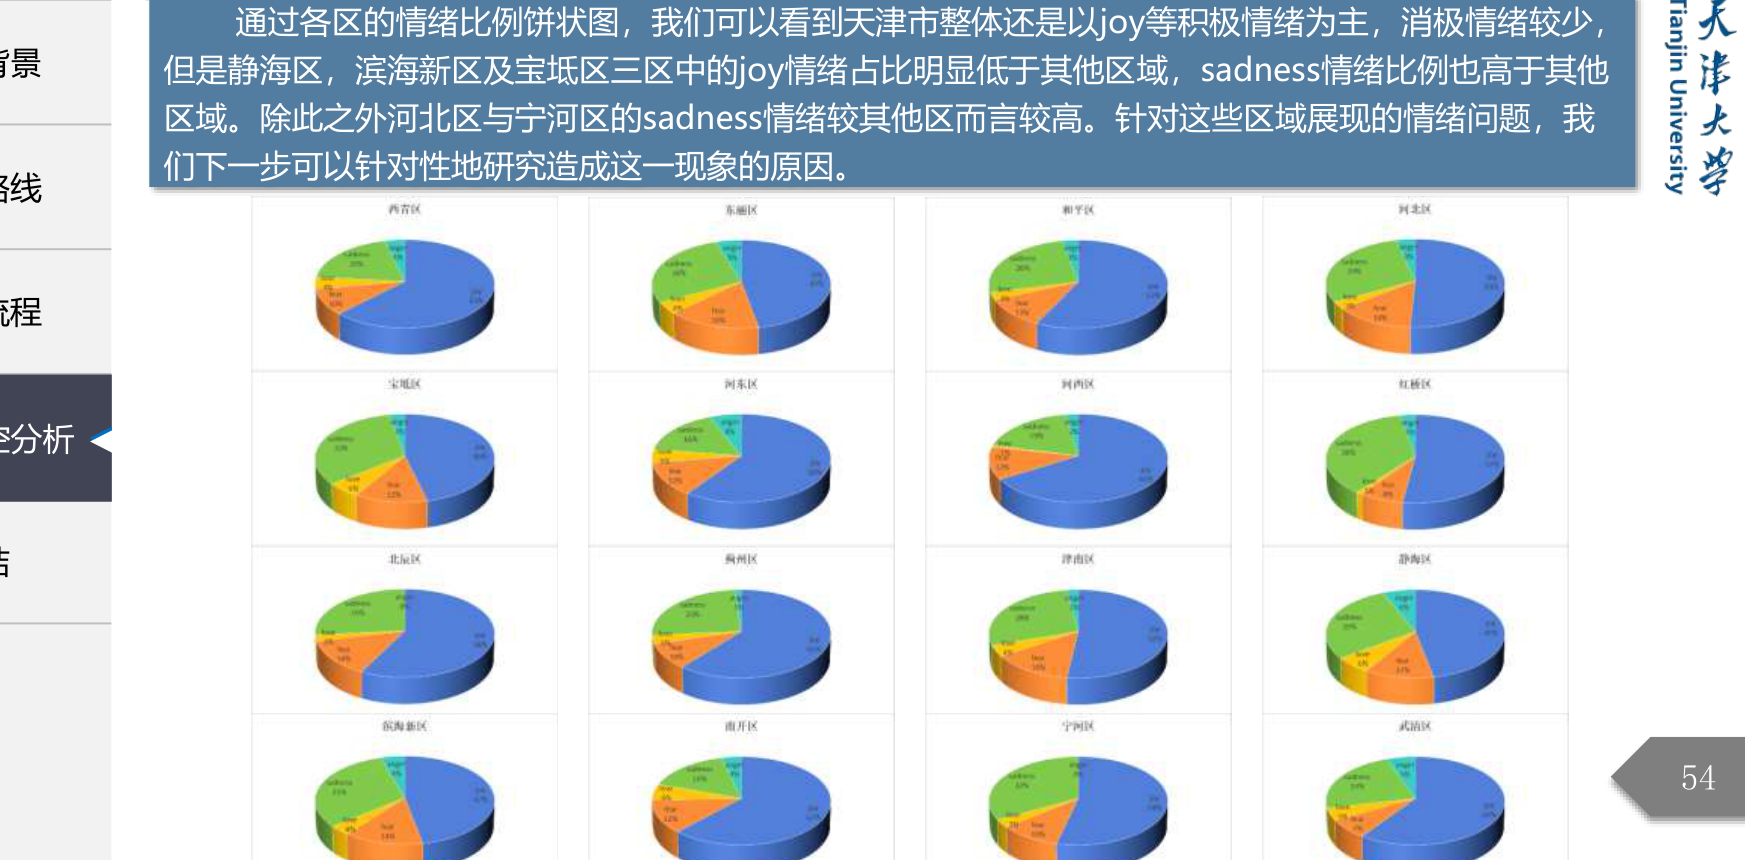
  • 4
    Spatial Aggregation:空间聚合: Calculate emotion ratios by district and import into ArcGIS 按区县统计情绪比例,导入ArcGIS
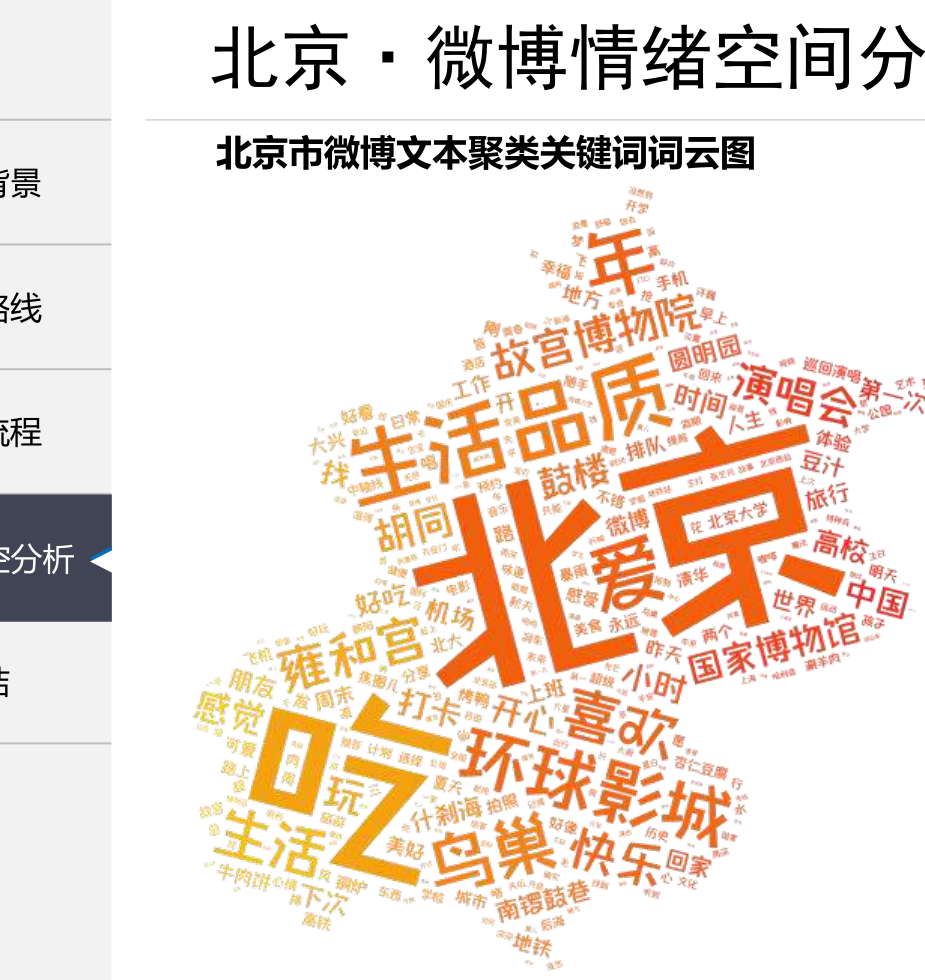
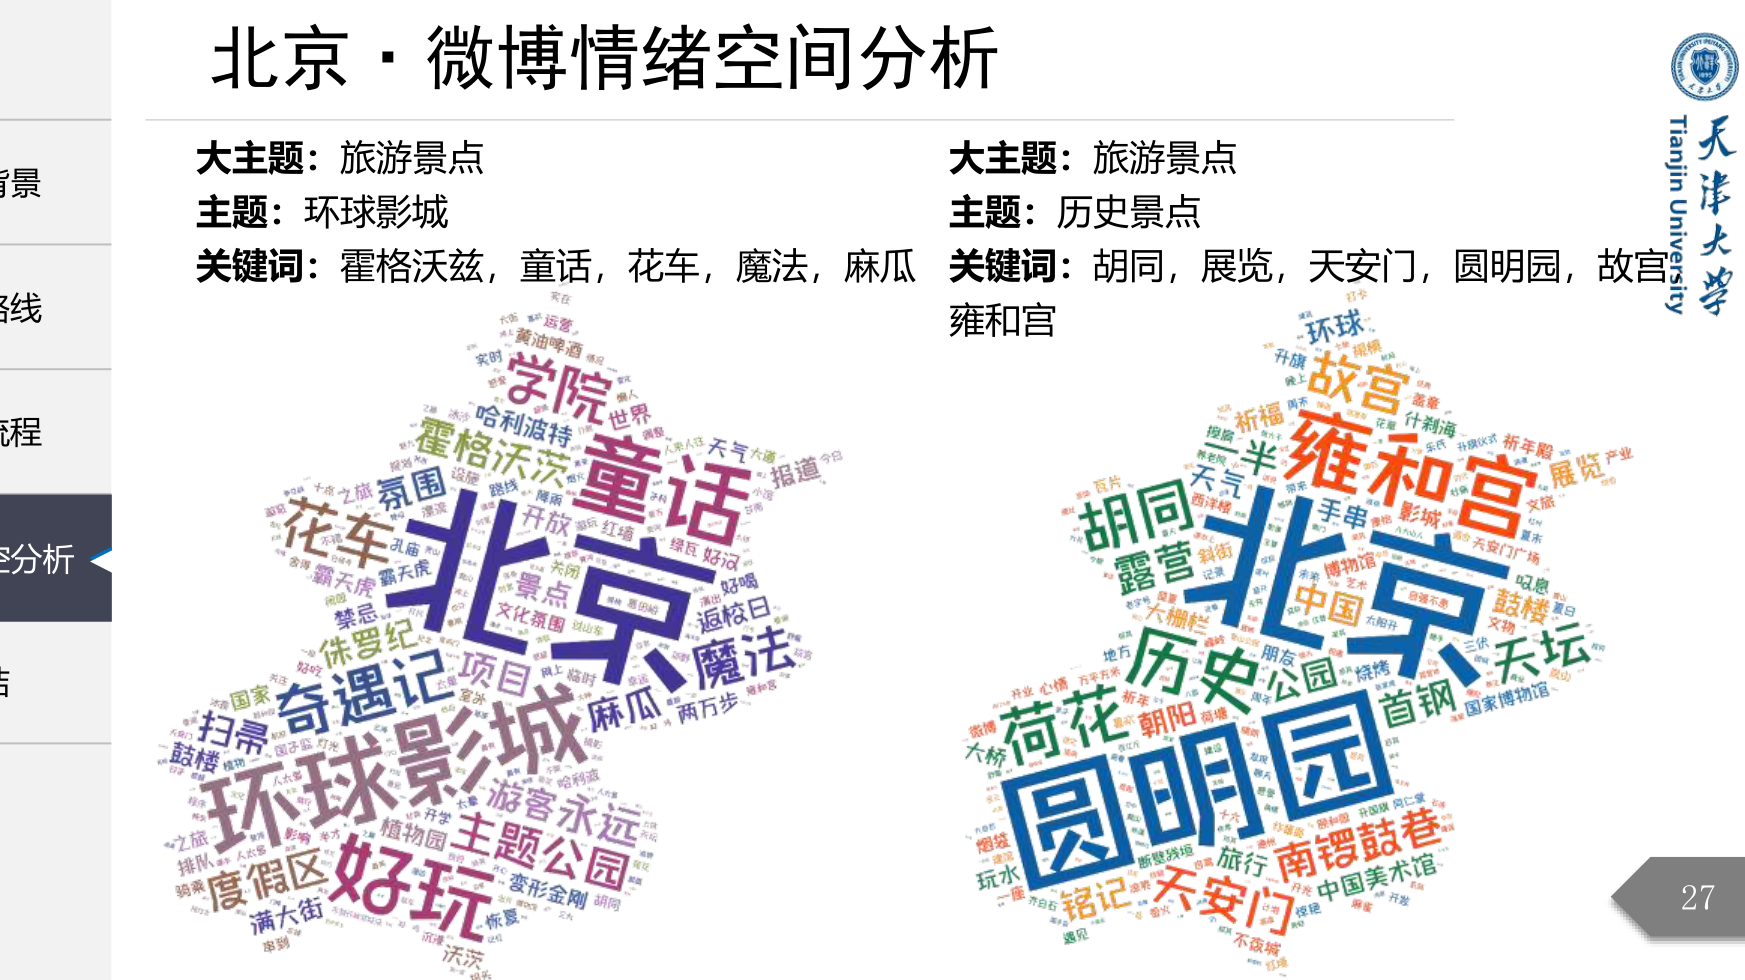
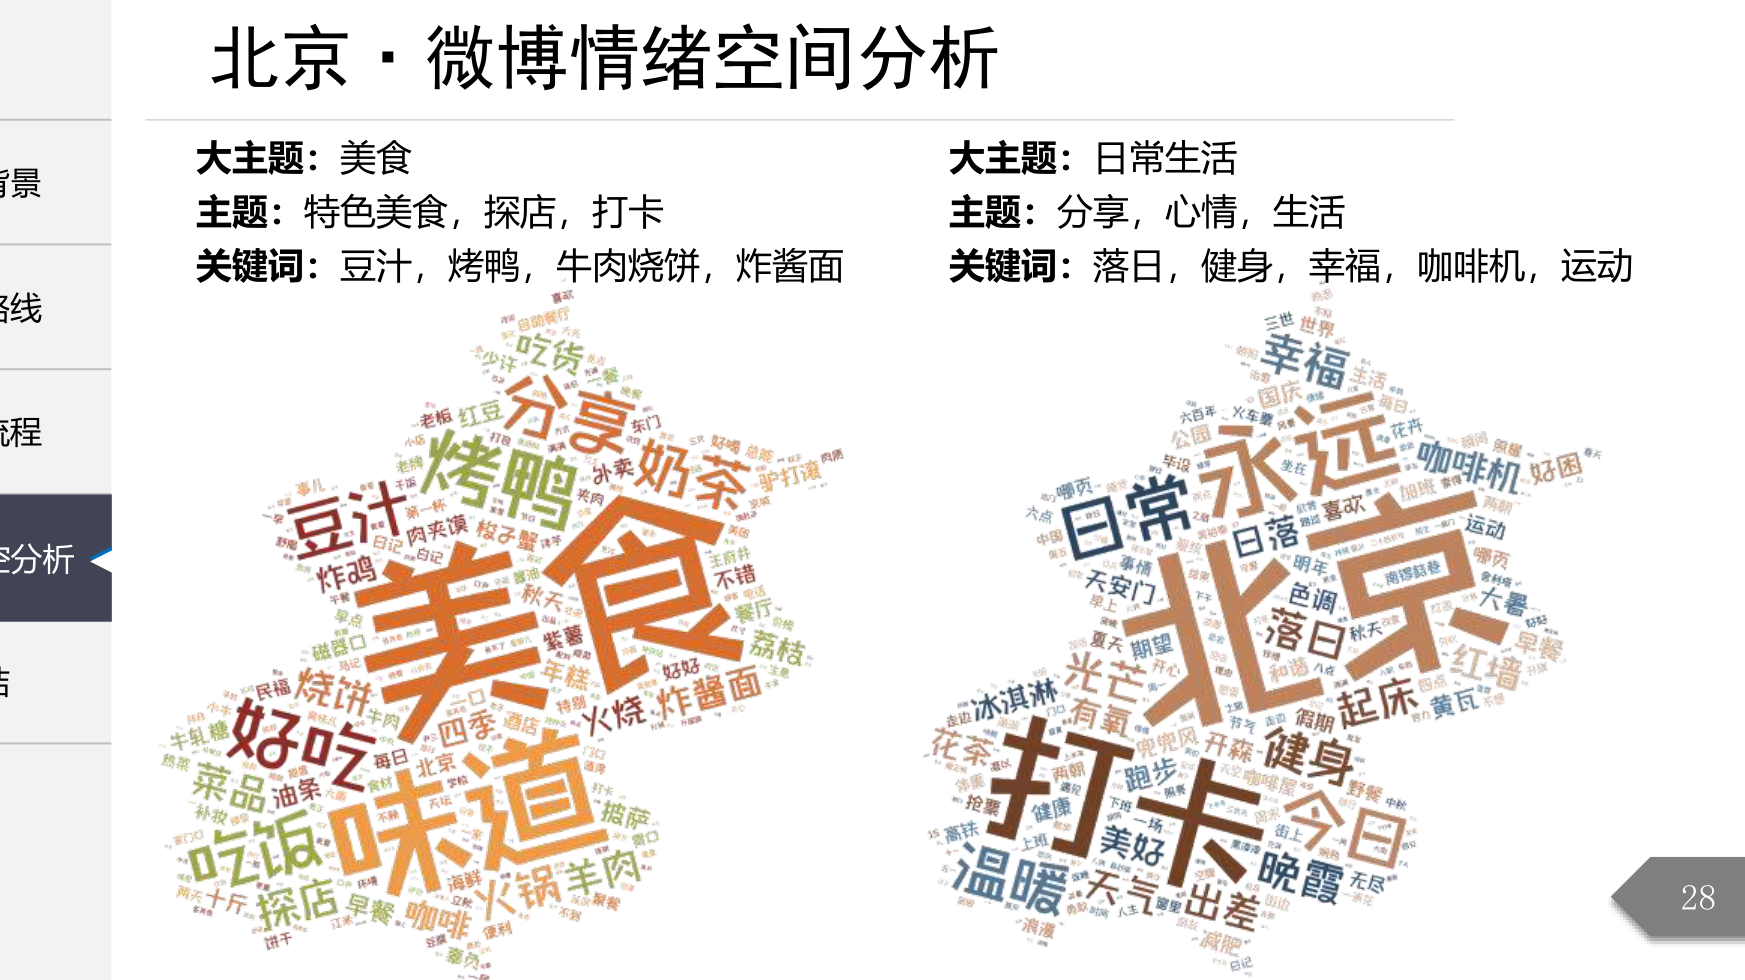
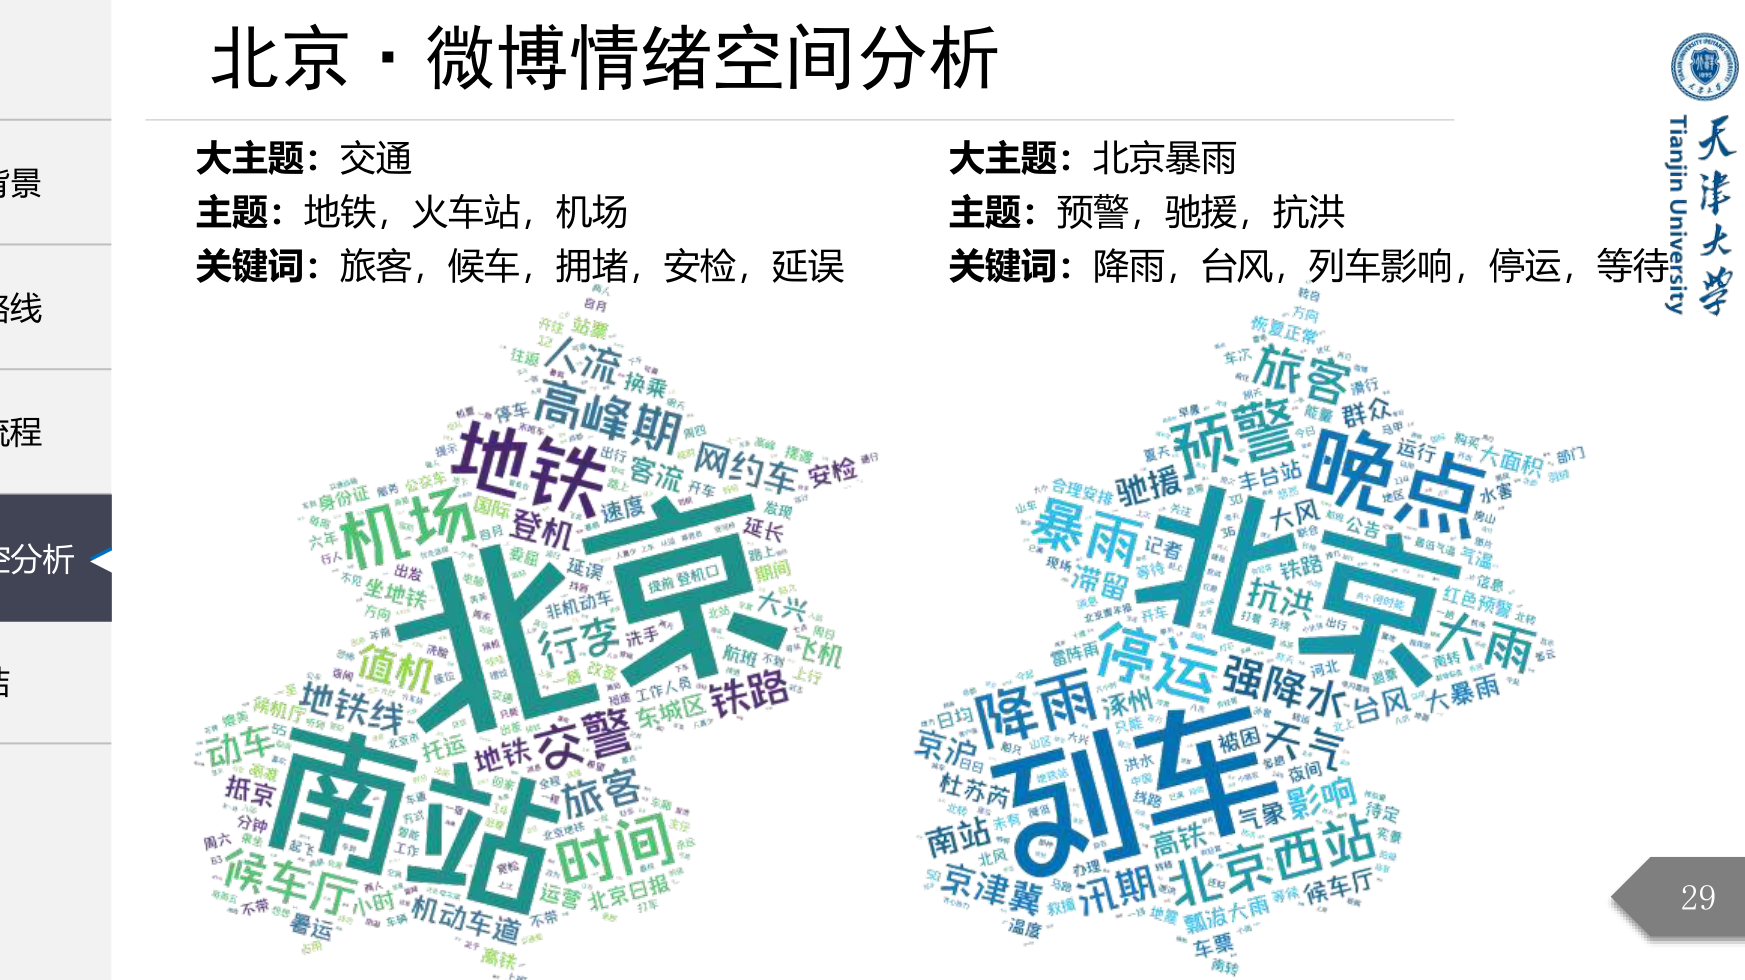
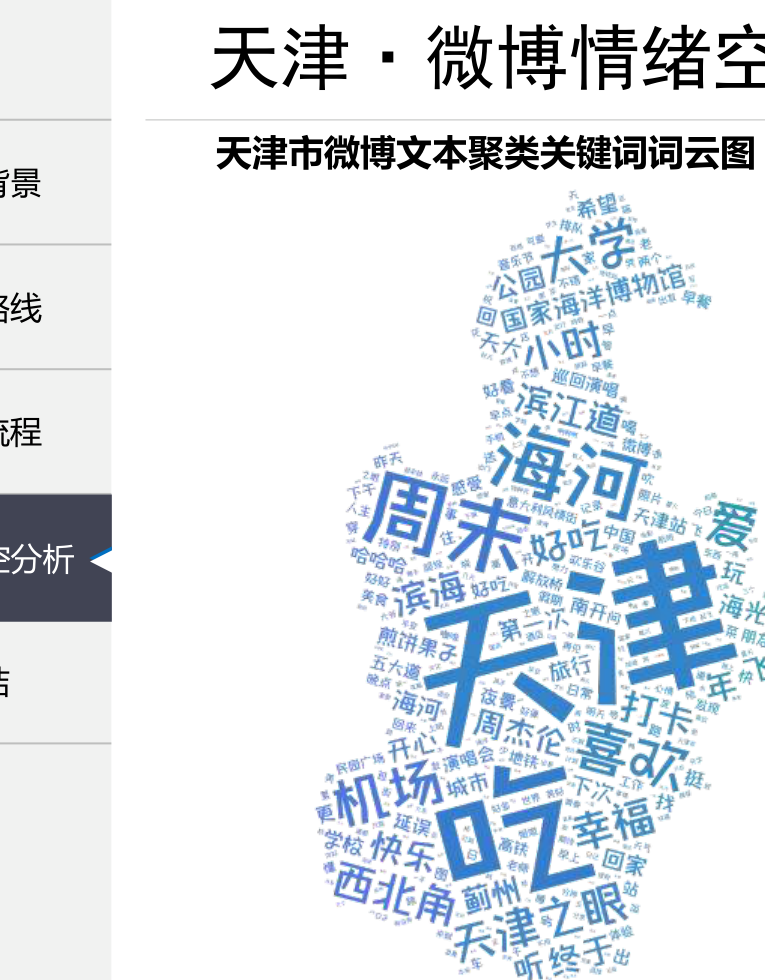
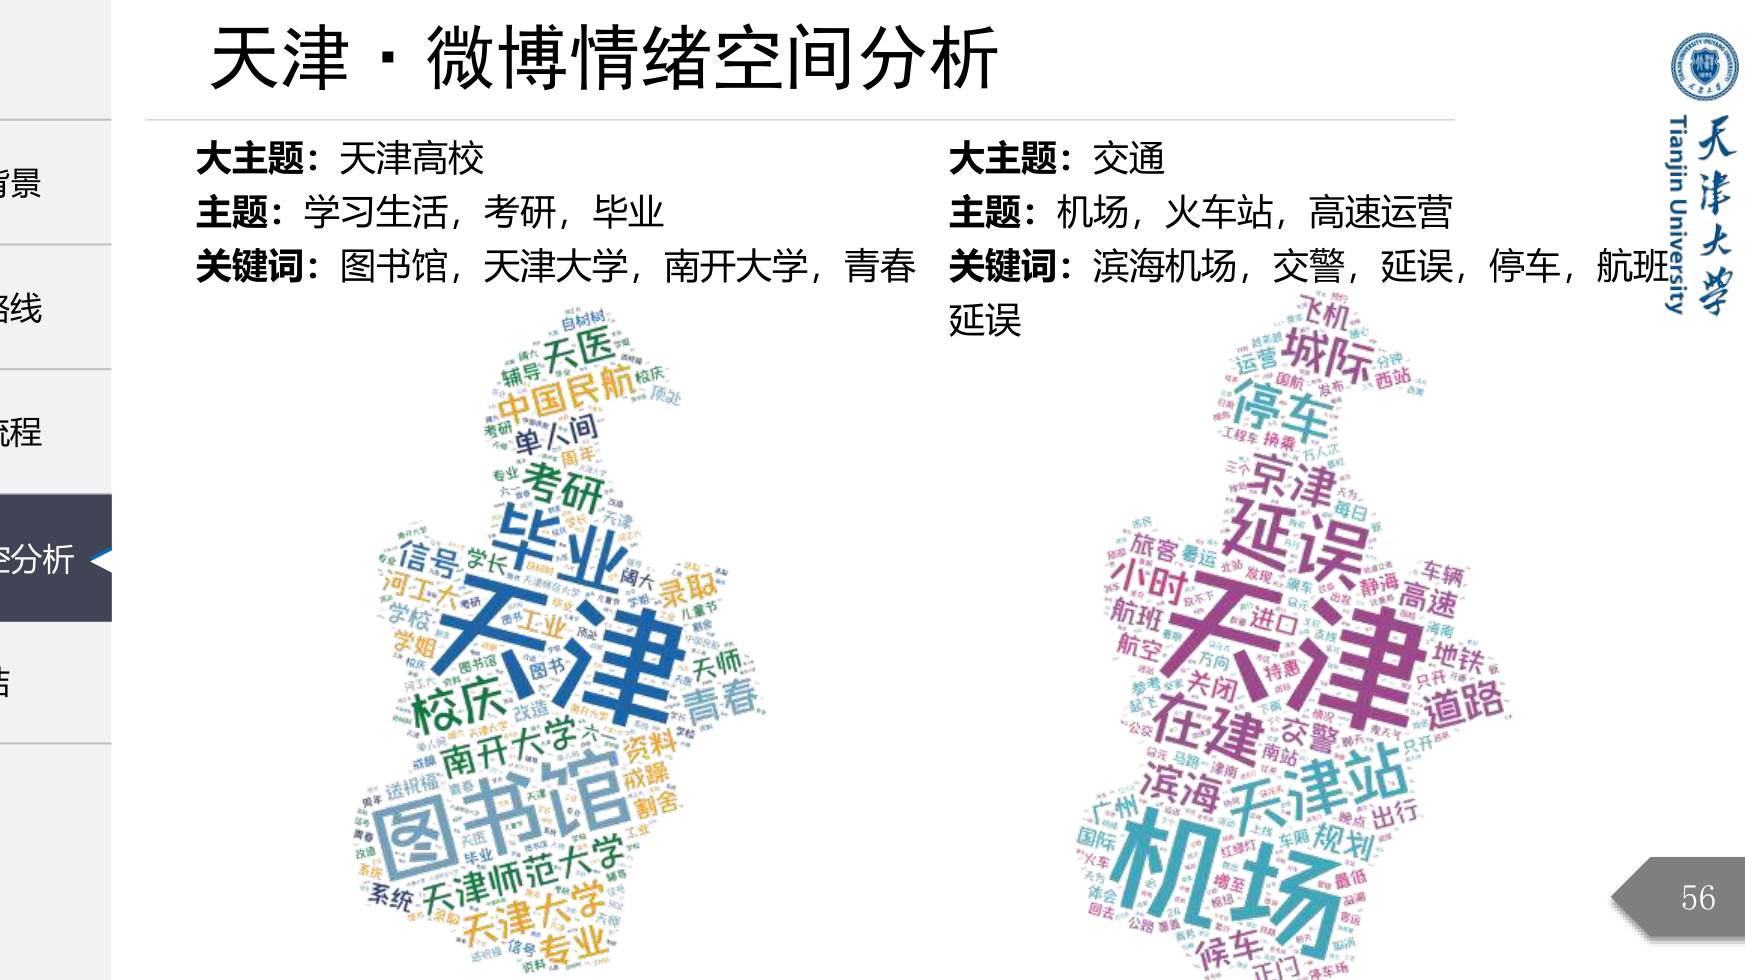
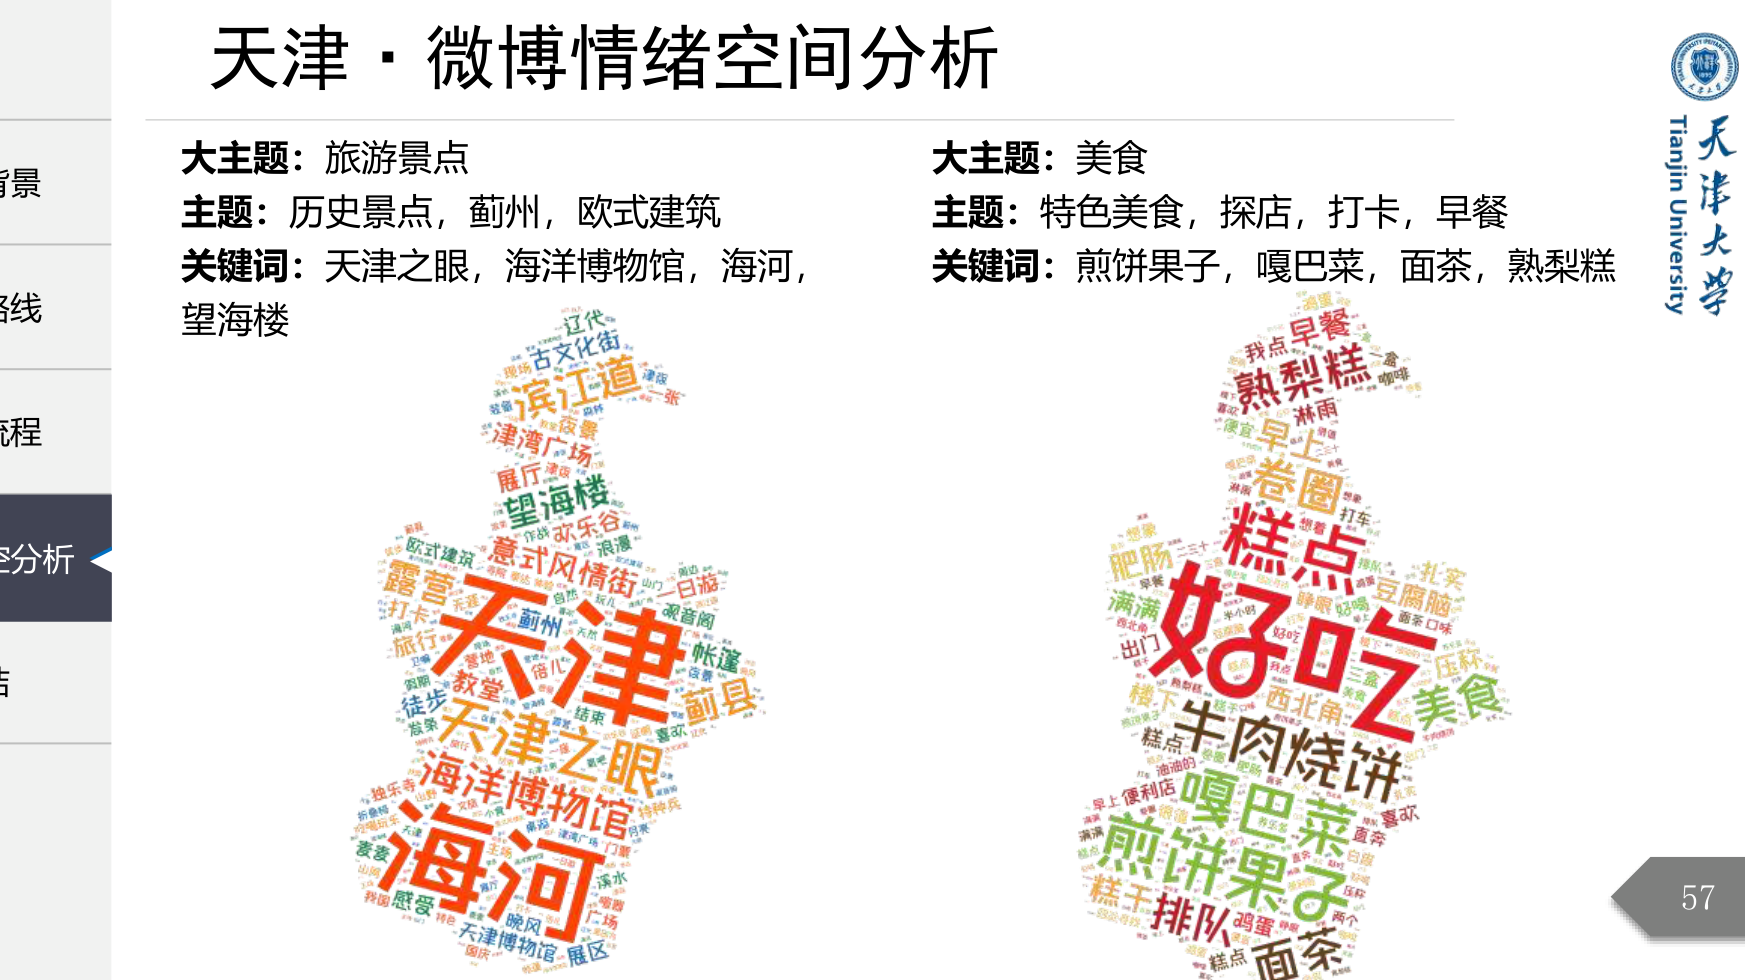
  • 5
    Text Clustering:文本聚类: Text segmentation → theme extraction → word cloud visualization 文本分词 → 提取主题 → 词云可视化
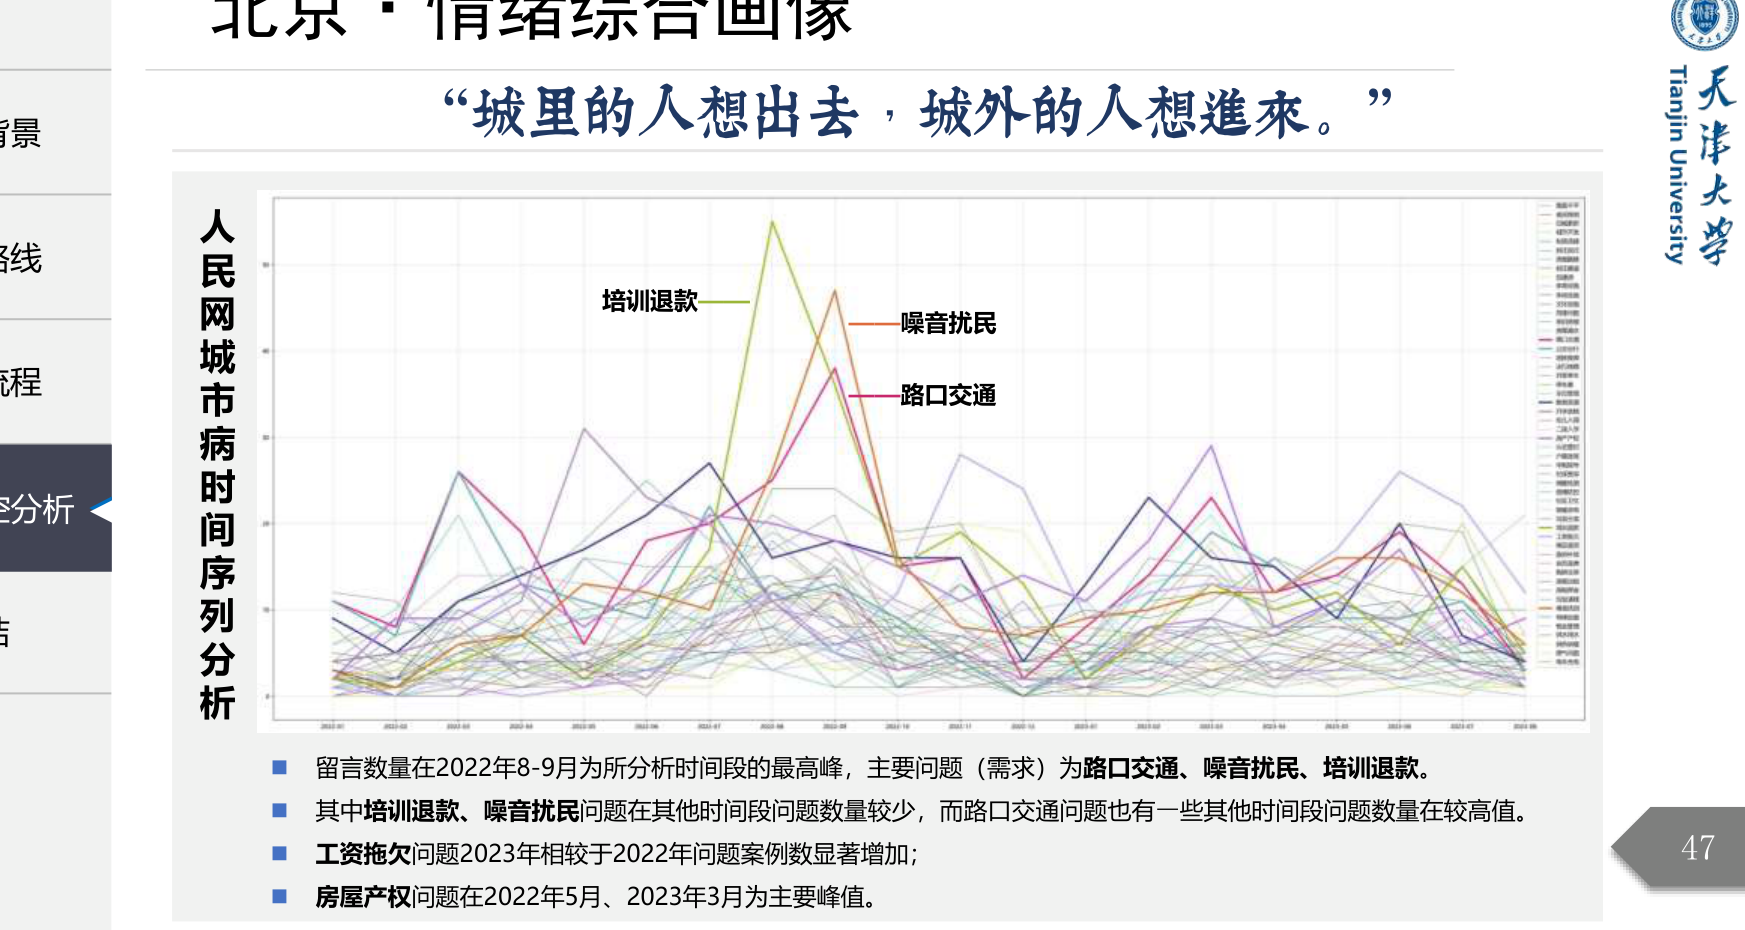
Temporal Dimension · Baidu Index 时间维度 · 百度指数

Time Series Analysis Pipeline时序分析流程

  • 1
    Keyword Library:关键词库: Build 128 emotion keywords covering all four cities 构建128项情绪关键词,覆盖四城市
  • 2
    Descriptive Statistics:基础统计: Seven metrics including max, mean, skewness, kurtosis, and std. deviation 最大值、均值、偏度、峰度、标准差等七项指标
  • 3
    Stationarity Testing:平稳性检验: Determine additive vs. multiplicative model selection 判断加法/乘法模型选择
  • 4
    STL Decomposition:STL分解: Seasonal · Trend · Residual component decomposition 季节性 · 趋势 · 残差成分拆解
  • 5
    Correlation Testing:相关性检验: Autocorrelation plots, normality tests, linking to People's Daily complaint data 自相关图、正态分布检验,关联人民网投诉数据
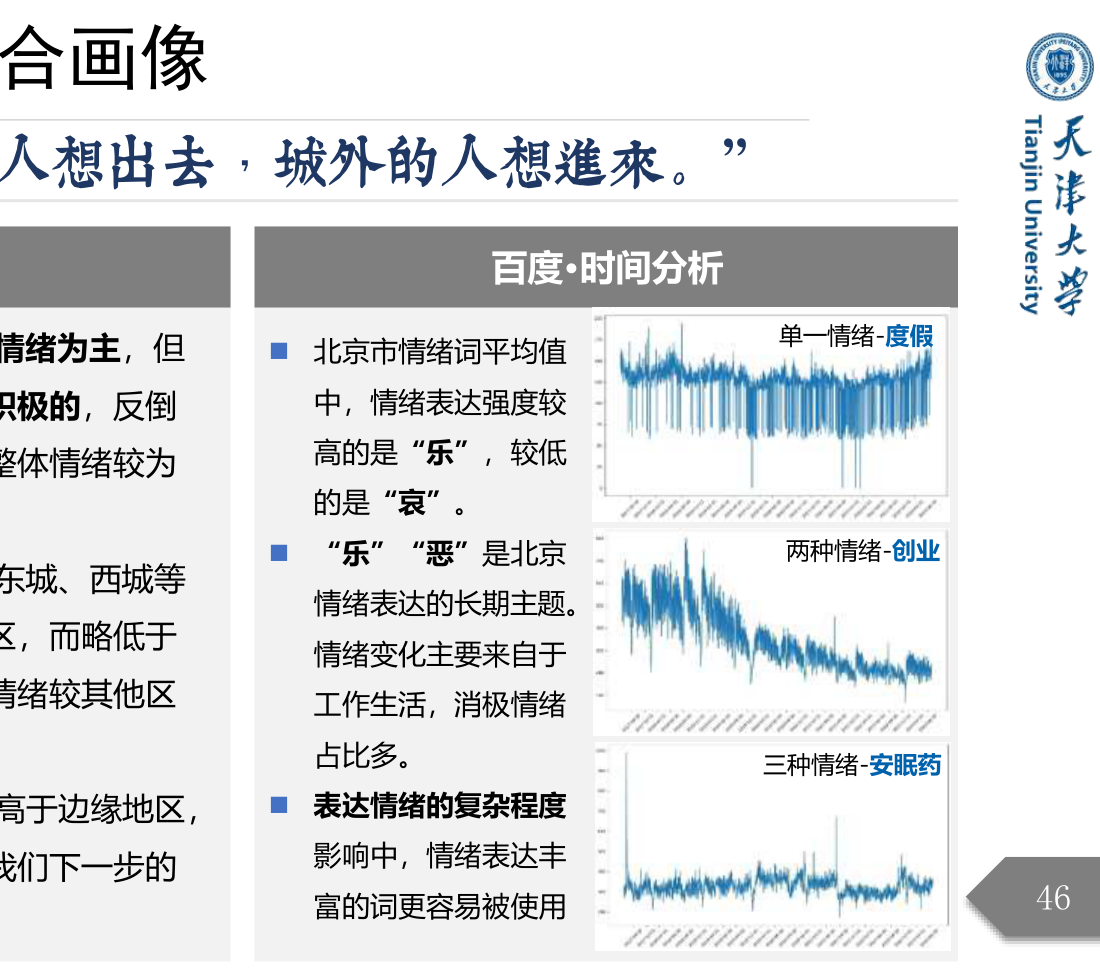
Representative Keyword Selection: Due to the large and overlapping number of emotion words, three representative keywords were selected for in-depth analysis — Vacation (single emotion · joy), Sleeping Pills (two emotions · fear + sadness 0.7/0.6), Entrepreneurship (three emotions · joy + fear + disgust 0.6/0.6/0.4). 代表性关键词选取:由于情绪词数量多、重复性高,最终选取三个代表性词汇进行深度分析—— 度假(单一情绪·乐)、安眠药(两种情绪·惧+哀 0.7/0.6)、创业(三种情绪·乐+惧+恶 各0.6/0.6/0.4)

Research Scope 研究范围

Four City Selection 四城市选取

四城市选取说明
Four municipalities selected from 25 cities as representatives, balancing commonalities (same administrative status, regional economic centers) and distinctions (differences in social structure, cultural heritage, geographic location, and population composition). 选取25城市中四个直辖市作为代表,兼顾共性(相同行政地位、区域经济中心)与个性(社会结构差异、文化底蕴差异、地理位置分异、人群组成不同)
Beijing北京
"Imperial Capital"
National political & cultural center
Int'l communication & tech innovation hub
"帝都"
全国政治中心 · 文化中心
国际交往中心 · 科技创新中心
Tianjin天津
"Humor Capital"
Advanced manufacturing & int'l port city
Northern economic center & eco-city
"哏都"
先进制造中心 · 国际港口城市
北方经济中心 · 生态城市
Shanghai上海
"Magic City"
Int'l economic & financial center
Int'l trade & shipping hub
"魔都"
国际经济中心 · 金融中心
国际贸易中心 · 航运中心
Chongqing重庆
"Mountain City"
Western financial hub & int'l gateway
Western comprehensive transport hub
"山城"
西部金融枢纽 · 西部国际综合
交通枢纽 · 国际门户枢纽

北京

Beijing北京

Urban Sentiment Spatio-temporal Analysis城市情绪时空分析

Spatial Analysis · Beijing 空间分析 · 北京

Weibo Sentiment Spatial Distribution 微博情绪空间分布

北京怒情绪分布
怒 Anger
北京惧情绪分布
惧 Fear
北京乐情绪分布
乐 Joy
北京爱情绪分布
爱 Love
北京哀情绪分布
哀 Sadness
Anger · Spatial Pattern: Districts with a high proportion of anger are mainly concentrated in central Beijing, with Chaoyang District showing the highest ratio. More opportunities for social interaction — work, study, and tourism — are concentrated in the city center. 怒·空间规律:anger占总情绪比例较高的地区主要分布于北京市城区中心,以朝阳区的比例最高。市中心的工作学习及旅游等人群交流活动的发生机会更多且聚集。
Fear · Spatial Pattern: Districts with higher proportions of fear are mainly Shunyi, Dongcheng, and Fengtai. Districts with lower fear proportions are concentrated in northwest Beijing. 惧·空间规律:fear占总情绪比例较高的地区主要是顺义区与东城区,丰台区。而比例较低的地区集中在北京西北部。
Joy · Spatial Pattern: Joy is mainly concentrated in northern districts including Yanqing, Huairou, Miyun, and Pinggu, while southern districts like Fengtai and Daxing show lower joy ratios. 乐·空间规律:joy主要集中分布于北部的延庆区、怀柔区、密云区、平谷区的聚集区,而偏南部的丰台区及大兴等区joy占总情绪比例较低。
Overall Characteristics: Northern areas like Yanqing and Huairou show generally positive sentiment with less negative emotion; in contrast, core urban districts like Chaoyang, Dongcheng, and Xicheng exhibit significantly higher negative sentiment than northern areas. 整体特征:延庆区与怀柔等北部地区的整体情绪较为开心,消极情绪较少;而作为市区核心的朝阳、东城、西城等区的消极情绪明显高于北部地区。
北京各区县情绪饼图
Beijing District Emotion Proportion Pie Charts: A breakdown of emotion composition by district, directly comparing the emotional differences between core urban areas and suburban areas — northern suburbs like Yanqing and Huairou show noticeably higher positive emotion proportions than southern urban districts. 北京各区县情绪比例饼图:各区县情绪构成一览,可直观对比核心城区与郊区的情绪差异——北部延庆、怀柔等郊区积极情绪占比明显高于南部城区。

Text Analysis · Beijing 文本分析 · 北京

Weibo Keywords & Word Clouds 微博关键词与词云

北京微博文本聚类关键词词云
Beijing Overall Word Cloud: High-frequency words include quality of life, Beijing, Universal Studios, etc. The overall emotion categories are diverse and representative of Beijing's urban character. 北京综合词云:生活品质、北京、环球影城等词汇高频出现,整体情绪分类较为丰富,且较能代表北京的城市特色。

Six Major Theme Categories六大主题分类

Tourism · Historical Sites旅游景点·历史景点
Hutong, Exhibition, Tiananmen, Yuanmingyuan, Forbidden City, Yonghe Temple胡同、展览、天安门、圆明园、故宫、雍和宫
Tourism · Universal Studios Beijing旅游景点·环球影城
Hogwarts, fairy tale, float parade, magic, Muggle霍格沃兹、童话、花车、魔法、麻瓜
Food · Local Specialties美食·特色
Douzhir, Peking duck, beef shaobing, zhajiang noodles豆汁、烤鸭、牛肉烧饼、炸酱面
Daily Life · Sharing日常生活·分享
Sunset, fitness, happiness, coffee machine, exercise落日、健身、幸福、咖啡机、运动
Transport · Subway Stations交通·地铁站
Passengers, waiting, congestion, security check, delays旅客、候车、拥堵、安检、延误
Beijing Rainstorm · Weather Alert北京暴雨·预警
Rainfall, typhoon, train disruption, suspension, waiting降雨、台风、列车影响、停运、等待
北京旅游景点词云
Tourism Theme: Left — Universal Studios (fairy tales, magic); Right — Historical sites (hutong, Tiananmen, Yuanmingyuan) 旅游景点主题:左—环球影城(童话魔法);右—历史景点(胡同、天安门、圆明园)
北京美食与日常词云
Food & Daily Life Theme: Left — Local specialties (Peking duck, zhajiang noodles, douzhir); Right — Daily sharing (sunset, fitness, coffee machine) 美食与日常生活主题:左—特色美食(烤鸭、炸酱面、豆汁);右—日常分享(落日、健身、咖啡机)
北京交通与天气词云
Transport & Rainstorm Events: Left — Subway transport (airport, south station, delays); Right — Beijing rainstorm (heavy rainfall, braking, waiting) 交通与暴雨事件:左—地铁交通(机场、南站、延误);右—北京暴雨(强降水、刹车、等待)

Temporal Analysis · Beijing 时间分析 · 北京

Baidu Sentiment Time Series 百度情绪时间序列

"Joy" is the long-term dominant theme of emotional expression in Beijing. Emotional changes mainly stem from work and daily life, with relatively small proportions of negative emotions. "乐"是北京情绪表达的长期主题,情绪变化主要来自工作生活,消极情绪占比相对较小。
Sleeping Pills (two emotions · fear + sadness) serves as a representative keyword with complex and rich emotional expression. Its higher search volume in Baidu Index indicates stronger representativeness for emotional signaling. 安眠药(两种情绪·惧+哀)作为代表词,情绪表达较为复杂丰富,其在百度指数中的需求量更容易被使用,说明该词对于情绪的代表性更强。
People's Daily complaint peaks occurred in August–September 2022, primarily for intersection traffic, noise disturbance, and training refunds. Wage arrears complaints significantly increased in 2023. Housing property disputes peaked from May 2022 to March 2023. 人民网投诉高峰出现在2022年8—9月,主要问题为路口交通、噪音扰民、培训退款;工资拖欠问题在2023年明显增加;房屋产权纠纷在2022年5月—2023年3月为主要峰值。
北京时间序列分析图
Representative Keyword Time Series: Single emotion · Vacation / Two emotions · Sleeping Pills / Three emotions · Entrepreneurship — showing search volume changes over time across different emotion complexity levels. 代表性关键词时序:单一情绪·度假 / 两种情绪·安眠药 / 三种情绪·创业,展示不同情绪复杂度的搜索量时间变化
北京人民网投诉时间序列
People's Daily Urban Issues Time Series (Beijing): Monthly trends of various urban complaint categories — intersection traffic, noise disturbance, and training refunds peaked in August–September 2022, while wage arrears increased significantly in 2023. 人民网城市病时间序列(北京):各类城市投诉问题的月度趋势——路口交通、噪音扰民、培训退款在2022年8-9月达到峰值,工资拖欠在2023年显著增加。

天津

Tianjin天津

Urban Sentiment Spatio-temporal Analysis城市情绪时空分析

Spatial Analysis · Tianjin 空间分析 · 天津

Weibo Sentiment Spatial Distribution 微博情绪空间分布

天津怒情绪分布
怒 Anger
天津惧情绪分布
惧 Fear
天津乐情绪分布
乐 Joy
天津爱情绪分布
爱 Love
天津哀情绪分布
哀 Sadness
Anger · Spatial Pattern: Districts with higher anger proportions are mainly on the periphery of Tianjin, while the northern districts show relatively better emotions. Wuqing, Jinghai, and Hedong districts have the highest proportions. 怒·空间规律:anger占总情绪比例较高的地区主要分布于天津的边缘地区,而市北部的情绪相对较好。武清区、静海区、河东区占比最高。
Fear · Spatial Pattern: Overall, only Dongli District shows a notably higher fear proportion, while districts with lower fear proportions are concentrated in northern Tianjin. 惧·空间规律:整体上只有东丽区的fear情绪比例较高,而总比例较低的地区集中在天津北部。
Joy · Spatial Pattern: High joy proportions are mainly concentrated in central-western districts including Wuqing, Beichen, and Xiqing, while southeastern areas like Binhai New Area, Jinghai, and Dongjian have lower joy ratios. 乐·空间规律:joy的高比例区主要集中中西部的武清、北辰及西青等区的聚集区域,而东南部的滨海新区及静海、东疆等区joy占总情绪比例较低。
Sadness · Spatial Pattern: High sadness proportions are concentrated in Binhai New Area, Ninghe, and Baodi districts. Overall, Tianjin's sadness proportion is higher compared to other cities. 哀·空间规律:sadness的高比例地区集中分布于滨海新区、宁河区及宝坻区三区,整体而言天津的sadness与其他城市相比占比较大。
天津各区县情绪饼图
Tianjin District Emotion Proportion Pie Charts: Overall, Tianjin is still dominated by positive emotions like joy. However, Jinghai, Binhai New Area, and Baodi districts show notably lower joy proportions than other areas, and higher sadness proportions. 天津各区县情绪比例饼图:天津整体还是以joy等积极情绪为主,消极情绪较少。但是静海区、滨海新区及宝坻区三区中的joy情绪占比明显低于其他区域,sadness情绪比例也高于其他地区。

Text Analysis · Tianjin 文本分析 · 天津

Weibo Keywords & Word Clouds 微博关键词与词云

天津微博词云
Tianjin Overall Word Cloud: High-frequency words include Haihe River, Tianjin, eat, weekend, etc. The emotion categories are diverse and representative of Tianjin's leisurely lifestyle. Six themes were identified: tourist attractions, universities, food, daily life, transportation, and concerts. 天津综合词云:海河、天津、吃、周末等词高频出现,整体情绪分类较为丰富,且较能代表天津悠闲的生活特色。最终筛选六个主题:旅游景点、天津高校、美食、日常生活、交通状况及演唱会。

Six Major Theme Categories六大主题分类

Tourism · Historical Sites旅游景点·历史景点
Tianjin Eye, Ocean Museum, Haihe River, Wanghai Tower天津之眼、海洋博物馆、海河、望海楼
Tianjin Universities · Study天津高校·学习
Library, Tianjin University, Nankai University, youth图书馆、天津大学、南开大学、青春
Food · Local Specialties美食·特色
Jianbing guozi, gaba cai, mian cha, cooked pear cake, beef shaobing煎饼果子、嘎巴菜、面茶、熟梨糕、牛肉烧饼
Transport · Airport & Stations交通·机场站
Binhai Airport, traffic police, delays, parking, flight delays滨海机场、交警、延误、停车、航班延误
天津高校与交通词云
University & Transport Theme: Left — Tianjin universities (graduate entrance exams, graduation, library, Nankai University); Right — Transport (airport, highway operations, flight delays) 高校与交通主题:左—天津高校(考研、毕业、图书馆、南开大学);右—交通(机场、高速运营、航班延误)
天津旅游与美食词云
Tourism & Food Theme: Left — Historical attractions (Tianjin Eye, Ocean Museum, Haihe River, Wanghai Tower); Right — Local food (jianbing guozi, gaba cai, beef shaobing, cooked pear cake) 旅游与美食主题:左—历史景点(天津之眼、海洋博物馆、海河、望海楼);右—特色美食(煎饼果子、嘎巴菜、牛肉烧饼、熟梨糕)

Emotion Lexicon 情绪词典

Representative Keyword In-depth Analysis 代表性关键词深度解析

From 128 keywords, three representative words were selected based on emotional complexity for complete time series analysis, representing single emotion, two emotions, and three emotions respectively. 从128个关键词中,依据情绪复杂度选取三个代表性词汇进行完整时序分析,分别代表单一情绪两种情绪三种情绪三类。

Vacation度假
Joy 1.0

Representative single-emotion keyword. "Vacation" shows strong seasonal patterns in Baidu Index, with search volumes spiking significantly around public holidays. The STL trend component is generally stable. Emotional expression is direct and positive, representing a positive lifestyle need. 代表单一情绪关键词。度假在百度指数中呈现强烈的季节性规律,节假日前后搜索量显著飙升,STL趋势成分总体平稳。情绪表达直接明确,代表正向生活需求。

Sleeping Pills安眠药
Fear 0.7 Sadness 0.6

Representative dual-emotion keyword. Time series analysis shows higher volatility; emotional expression is complex and rich. Its higher search frequency in Baidu Index demonstrates stronger representativeness for emotional conveyance, often spiking following mental health events. 代表两种情绪关键词。时序分析显示出较高的波动性,其情绪表达复杂丰富,在百度指数中的检索频率较高,说明该词对于情绪传递具有更强代表性,常在心理健康事件期后出现峰值。

Entrepreneurship创业
Joy 0.6 Fear 0.6 Disgust 0.4

Representative triple-emotion keyword. "Entrepreneurship" reflects hope for the future (joy) alongside risk anxiety (fear) and dissatisfaction with the status quo (disgust). The time series is highly correlated with economic conditions, with notable search volume changes during the pandemic. 代表三种情绪关键词。创业词汇折射出对未来的期许(乐)与风险担忧(惧),以及对现状的不满(恶)。时序上与经济形势高度相关,疫情期间搜索量明显变化。


Research Conclusions 研究结论

Key Findings & Urban Emotional Profiles 主要发现与城市情绪画像

"Those inside the city want to leave; those outside want in." — The core thesis of Beijing's composite emotional profile: core urban districts show higher negative sentiment, while northern suburban areas are generally more positive and optimistic. "城里的人想出去,城外的人想进来。" ——北京情绪综合画像的核心命题:核心城区消极情绪偏高,而北部郊区整体情绪较为积极开朗。

Spatial Patterns (Weibo Dimension)空间规律(微博维度)

  • Northern suburbs (Yanqing, Huairou, Miyun, etc.) show generally positive emotions with low negative proportions北部郊区(延庆、怀柔、密云等)整体情绪积极,消极情绪占比低
  • Core urban districts (Chaoyang, Dongcheng, Xicheng) show significantly higher negative sentiment than suburbs核心城区(朝阳、东城、西城)消极情绪明显高于郊区
  • Urban fringe areas like Fengtai show overall lower positive emotions than other districts城市边缘区如丰台区积极情绪比其他区整体较低
  • Tianjin's Jinghai and Binhai New Area show significantly higher sadness proportions than other districts天津静海、滨海新区的sadness占比显著高于其他区
  • All four cities are dominated by positive emotions (joy + love), with fewer negative emotions四城市均以积极情绪(乐+爱)为主导,消极情绪较少

Temporal Patterns (Baidu Dimension)时间规律(百度维度)

  • Emotion keyword search volumes show clear seasonal cycles, with significant fluctuations around public holidays情绪关键词搜索量呈现明显季节性周期,节假日前后波动显著
  • "Joy" is the long-term dominant emotional theme across all four cities"乐"是四城市情绪表达的长期主导主题
  • During the pandemic (2020–2022), multiple keyword categories showed abnormal spikes疫情期间(2020—2022)多类关键词出现异常峰值
  • Work-related words (996, overtime, wages) are highly correlated with economic conditions工作类词汇(996、加班、工资)与经济形势高度相关
  • Keywords with higher emotional complexity show stronger time series volatility情绪复杂度越高的关键词,其时间序列波动性越强

City-Specific Focus Areas城市主导关注点

  • Beijing: Universal Studios, historical sites, Beijing rainstorm events北京:环球影城、历史景点、北京暴雨事件
  • Tianjin: Haihe River tourism, university culture, local cuisine天津:海河旅游、高校文化、特色美食
  • Shanghai: Disneyland, concerts, international events上海:迪士尼、演唱会、国际活动
  • Chongqing: Mountain city scenery, hotpot cuisine, leisure lifestyle重庆:山城景色、火锅美食、生活享乐
  • All cities show tourism, food, and transportation as three core topics各城市均表现出旅游、美食、交通三大核心话题

Urban Issues Correlation Analysis城市病关联分析

  • People's Daily complaint data shows temporal correlation with emotion keywords人民网投诉数据与情绪关键词具有时序相关性
  • Intersection traffic and noise complaints peak in summer (August–September)路口交通、噪音扰民在夏季(8—9月)投诉量最高
  • Training refund and wage arrear complaints align with economic fluctuation cycles培训退款、工资拖欠与经济波动周期吻合
  • Housing property disputes peaked from May 2022 to March 2023房屋产权纠纷在2022年5月至2023年3月为主要峰值
  • Level of urban infrastructure development shows positive correlation with spatial emotion distribution城市设施完善程度与情绪空间分布存在正相关